
Description
Support & Resistance Pro identifie les zones de support et de résistance et — contrairement à la plupart des outils S/R — mesure si ces zones fonctionnent réellement, en utilisant un moteur statistique indépendant basé sur des données historiques réelles plutôt que sur des suppositions. Chaque zone affiche une statistique de taux de maintien avec un intervalle de confiance, calculée à partir de la population historique complète des zones, y compris celles qui ont ensuite été franchies et ont disparu du graphique. La plupart des indicateurs de cette catégorie ne comptent que les niveaux encore visibles aujourd'hui, ce qui gonfle silencieusement chaque affirmation de force faite. Celui-ci ne le fait pas.
Caractéristiques clés
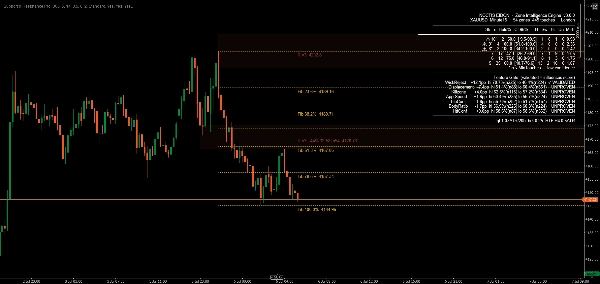
- Zones validées statistiquement Chaque zone porte un taux de maintien réel, mesuré historiquement, avec un intervalle de confiance de 95 % — pas un score de force supposé. Un signal, le rejet de mèche au point de contact, a été formellement validé : confirmé sur EURUSD et Bitcoin, sur plusieurs périodes, y compris un véritable test hors échantillon où l'effet a maintenu sa force sur des données inédites.
- Inversion automatique des rôles Le support cassé devient automatiquement une résistance, et vice versa, avec un marqueur visuel distinct — l'indicateur suit de quel côté du prix se trouve une zone et la colore en conséquence, plutôt que de fixer la couleur à la façon dont la zone s'est initialement formée.
- Confluence de période supérieure Les zones sur votre graphique sont vérifiées par rapport à une période supérieure de votre choix, avec la structure HTF correspondante dessinée directement sur le graphique comme une superposition visuelle distincte.
- Intégration du retracement de Fibonacci Niveaux automatiques de retracement de Fibonacci du dernier swing, chacun étiqueté avec le ratio et le prix exact selon la précision native de votre courtier, désencombrés automatiquement par rapport aux zones proches afin que les étiquettes ne se chevauchent jamais.
- Alerte de saturation Les zones testées trop souvent sont signalées plutôt que supposées plus fortes — nos données montrent que les zones fortement testées ont tendance à performer moins bien, probablement parce que leur liquidité de repos a déjà été utilisée.
- Porte de validation ouverte Six signaux candidats supplémentaires — ratio du corps, vitesse d'approche, timing de session/killzone, et test de déplacement — sont affichés en direct sur le panneau statistique intégré avec leurs propres lectures de taux de maintien. Ils n'influencent aucun score ou classement tant que chacun n'a pas indépendamment franchi la même barre de preuve que le rejet de mèche. Vous voyez exactement ce qui est prouvé et ce qui ne l'est pas.
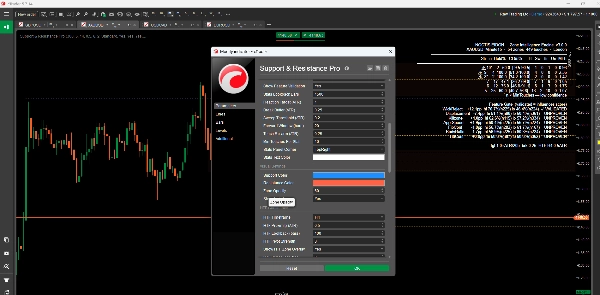
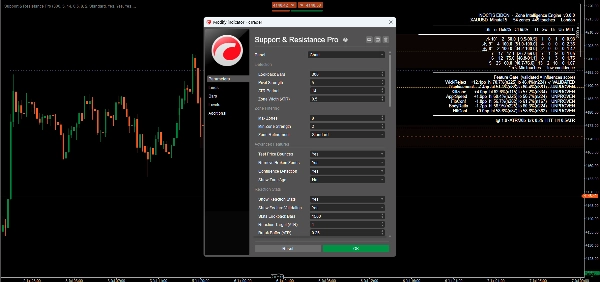
- Paramètres personnalisables Contrôle étendu des paramètres sur la sensibilité de détection, le filtrage des zones, le style visuel et le comportement des alertes.
- Alertes en temps réel Alertes configurables par pop-up, email et son pour les touches de zone, les cassures et les événements de confluence, activables indépendamment par canal.
Avantages
- Preuve plutôt que supposition : chaque statistique sur le graphique peut être vérifiée indépendamment — l'indicateur inclut ses propres outils de vérification in-sample/out-of-sample
- Pas de biais de survie : les affirmations de force sont basées sur la population historique complète des zones, pas seulement sur les niveaux qui ont survécu
- Divulgation honnête : les signaux prouvés et non prouvés sont étiquetés comme tels, sur le graphique, en permanence
Idéal pour
Les traders qui veulent voir la preuve statistique derrière un niveau, pas seulement une ligne — les day traders, swing traders et traders systématiques sur le forex, la crypto et d'autres instruments cherchant une approche rigoureusement mesurée du support et de la résistance.
Conclusion
Support & Resistance Pro est construit autour d'un principe : une affirmation de force n'est pas réelle tant qu'elle n'est pas mesurée. Un signal a franchi cette barre avec une confirmation inter-instrument, inter-période et hors échantillon. Les autres sont affichés honnêtement comme étant encore en cours de test — car un chiffre que vous ne pouvez pas vérifier ne vaut pas la peine d'être affiché.
Résumé
- Dynamic support and resistance levels that adjust in real-time based on recent price action.
- Multi-timeframe analysis to view levels across different timeframes for a comprehensive market overview.
- Calculation and display of pivot points to mark potential intraday reversal zones and target prices.
- Highlighting of psychological price levels (round numbers) to gauge market sentiment.
- Integration of Fibonacci retracement levels to assist in identifying support and resistance during price corrections.
- Customizable settings for lookback periods, visualization styles, and color schemes to suit individual trading preferences.
- Clear graphical representation for easy identification of market conditions.
- Configurable real-time alerts when prices approach critical levels.
This indicator supports various trading styles including scalping, day trading, and swing trading, and is suitable for traders in forex, commodities, stocks, and indices markets. It is intended for both beginner and experienced traders seeking structured market analysis and enhanced decision-making through reliable support and resistance data.
Avis clients
5 | 100 % | |
4 | 0 % | |
3 | 0 % | |
2 | 0 % | |
1 | 0 % |


