
설명
초보 트레이더들이 가장 많이 저지르는 실수 중 하나는 너무 많은 지표를 추가하여 차트에 가능한 한 많은 정보를 담으려 하다 보니, 결과적으로 선과 데이터로 가득 찬 잡음이 많은 차트가 되어 트레이더에게 상충되는 이야기를 전달하는 것입니다.
장점:
- 반전 감지에 있어 놀라운 정확성.
- 시각적으로 보기 좋고 시장 상황을 쉽게 파악할 수 있음.
- 추세 매매 지표 또는 역추세 매매 지표로 사용할 수 있음.
- 강력한 백테스트 결과 (~95%의 극단 신호 정확도).
단점:
- 과매수 "극단" 및 과매도 "극단" 조건에서도 지표가 때때로 매우 강한 추세와 반대 방향으로 거래하게 하여 가격이 결국 반전되기 전 큰 손실을 초래할 수 있음.
- 15분 이상 시간 프레임에서 과매수 "극단" 및 과매도 "극단" 신호가 드물 수 있음. 이를 보완하기 위해 최소 8개의 주요 통화쌍을 거래하여 자주 극단 신호를 받는 것이 권장됨.
Chaos Reversals 사용법
Chaos를 사용한 간단하고 성공적인 시스템은 주간 및 일간 지지선과 저항선을 표시하고, 15분 Chaos의 과매수 극단 및 과매도 극단 신호를 이용해 해당 지지선과 저항선에서 다가오는 반등을 역추세 매매하는 방식으로 만들 수 있습니다.
신호는 다음과 같이 생성됩니다:
- 빠른 W%R이 먼저 움직이고, 그 다음 느린 W%R이 움직임.
- 단일 빠른 W%R이 과매도 또는 과매수 상태일 때, 이러한 반전을 스캘핑할 수 있음.
- 빠른 W%R과 느린 W%R이 모두 과매도 또는 과매수 상태일 때, 이는 시장이 상당한 정도로 반전할 것임을 나타냄.
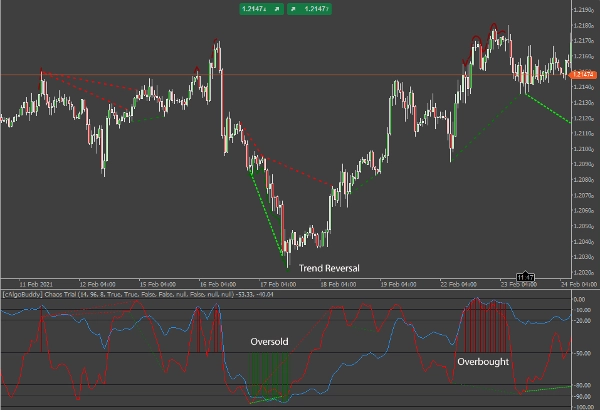
지표는 가격 차트의 저점 또는 고점 위에 빨간색 또는 녹색 선을 그리며, 지표 영역에도 과매도 또는 과매수 극단 조건을 표시하는 빨간색 또는 녹색 선을 그립니다. 이 기능은 지표 옵션에서 비활성화할 수 있습니다.
다이버전스 찾기
W%R은 오실레이터이기 때문에 다이버전스를 찾아 거래할 기회를 제공합니다. 다이버전스에는 두 가지 주요 유형이 있습니다: 정규와 숨겨진입니다.
- 정규 다이버전스는 가격 방향의 반전을 나타냅니다.
- 숨겨진 다이버전스는 가격 방향의 지속을 나타냅니다.
각 주요 유형 내에는 다음과 같은 2차 분류가 있습니다: 약세(부정적) 및 강세(긍정적)입니다.
- 약세 다이버전스는 지표가 하락하는 동안 가격이 상승하거나 횡보할 때 발생합니다.
- 강세 다이버전스는 지표가 상승하는 동안 가격이 하락하거나 횡보할 때 발생합니다.
정규 다이버전스
정규 다이버전스는 가장 간단히 말해 다음과 같습니다:
- 가격은 더 높은 고점을 만들고 있지만 W%R 빠른 선은 더 낮은 고점을 만들고 있음: 잠재적 매도 신호.
- 가격은 더 낮은 저점을 만들고 있지만 W%R 빠른 선은 더 높은 저점을 만들고 있음: 잠재적 매수 신호.
어느 경우든 트레이더는 가격 움직임의 잠재적 반전을 찾습니다.
정규 다이버전스는 현재 스윙 고점 또는 저점을 이전 스윙 고점 또는 저점과 비교하는 데 가장 잘 사용됩니다. 정규 다이버전스가 나타나면 추세가 약화되고 시장 심리가 반대 방향으로 전환되었음을 의미합니다. 트레이더는 유리한 반전 또는 되돌림 거래를 준비할 수 있습니다.
Chaos Reversals에서 정규 다이버전스는 다음과 같이 표시됩니다:
- 강세 정규 다이버전스 – 밝은 녹색 좁은 점선.
- 약세 정규 다이버전스 – 빨간색 좁은 점선.
참고: 다이버전스 라인은 확인된 다이버전스 다음 바의 시가에 나타납니다.
숨겨진 다이버전스
숨겨진 다이버전스는 가장 간단히 말해 다음과 같습니다:
- 빠른 W%R 선이 더 낮은 저점을 만들고 있지만 가격은 더 높은 저점을 만들고 있음: 잠재적 매수 신호.
- 빠른 W%R 선이 더 높은 고점을 만들고 있지만 가격은 더 낮은 고점을 만들고 있음: 잠재적 매도 신호.
어느 경우든 트레이더는 가격 움직임의 잠재적 지속을 찾습니다.
숨겨진 다이버전스는 현재 추세와 관련된 가격을 평가하는 데 가장 잘 사용됩니다. 되돌림 후 가격은 종종 마지막 스윙 고점 또는 저점 수준을 향해 추세 방향으로 계속 움직입니다. 숨겨진 다이버전스가 나타나면 추세가 약화되고 있을 수 있지만 아직 완료되지 않은 상태입니다. 아래 예시처럼 시장은 아마도 이익 실현으로 인해 되돌림을 보였고 하락 추세를 재개하려는 모습입니다.
Chaos Reversals에서 숨겨진 다이버전스는 다음과 같이 표시됩니다:
- 약세 숨겨진 다이버전스 – 녹색 넓은 점선.
- 강세 숨겨진 다이버전스 – 짙은 빨간색 넓은 점선.
다이버전스와 함께 거래하기
다이버전스로 거래할 때 주의할 점을 간단히 말씀드립니다. 시장이 다이버전스 신호 방향으로 움직이지 않을 수도 있음을 인지하세요. 다이버전스는 시장 방향의 잠재적 변화 또는 지속을 나타내는 신호임을 이해하는 것이 중요합니다. 시장 방향을 확인하기 위해 가격 움직임을 모니터링하는 것이 중요하며, 또한 지표 선과 레벨(극단 과매수는 0, 극단 과매도는 -100)을 비교하여 Chaos 지표의 전체 방향도 주목하세요.
알림 및 통지
전송되는 신호는 극단 과매수/과매도 시작 및 종료, 극단 위치에서 느린 W%R 피크, 그리고 모든 다이버전스입니다.
텔레그램 알림
텔레그램에 봇과 채널이 설정되어 있다면, Chaos Reversals 지표가 통화쌍에 대한 확인된 신호 메시지를 전송합니다.
중요:
시간대가 로컬 시간에 맞게 정확히 조정되었는지 확인하세요(애플리케이션 오른쪽 하단 코너).
데스크톱 알림
예를 선택하면 Chaos Reversals 지표가 개인 데스크톱에 확인된 신호에 대한 메시지 상자 알림을 보냅니다.
이메일 알림
이 기능을 사용하려면 먼저 cTrader에서 이메일 전송을 설정해야 합니다(설정-> 이메일).
요약
고객 리뷰
5 | 100 % | |
4 | 0 % | |
3 | 0 % | |
2 | 0 % | |
1 | 0 % |


