
Description
La suite ultime de chandeliers est là pour vous aider à détecter la plupart des motifs de chandeliers existants aujourd'hui.
Les motifs de chandeliers, qui sont des outils techniques de trading, sont utilisés depuis des siècles pour prédire la direction des prix. Il existe divers motifs de chandeliers utilisés pour déterminer la direction et le momentum des prix, notamment le three line strike, le two red gapping, le three red crows, l'evening star et l'abandoned baby.
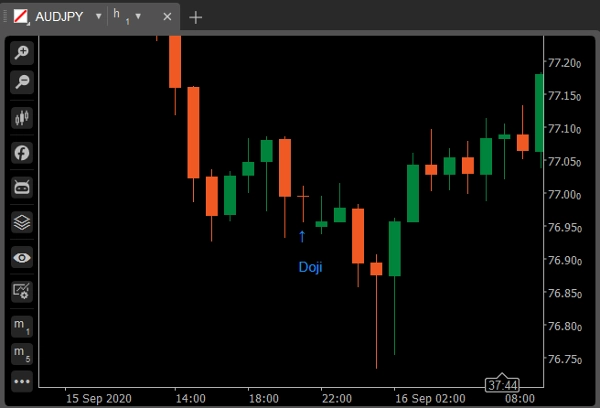
Doji
Un chandelier doji se forme lorsque l'ouverture et la clôture d'un titre sont pratiquement égales pour la période donnée et signale généralement un motif de retournement pour les analystes techniques. Le seuil du corps est au maximum de 5 % de la longueur totale.
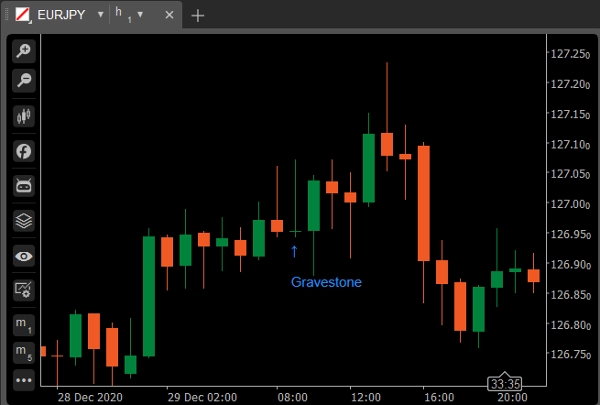
Variation : Doji pierre tombale
Il se forme lorsque les prix haut, ouverture et clôture de l'actif sont (presque) les mêmes. La longue ombre inférieure suggère qu'il y a eu une vente agressive pendant la période du chandelier, mais comme le prix a clôturé près de l'ouverture, cela montre que les acheteurs ont pu absorber la vente et repousser le prix vers le haut.
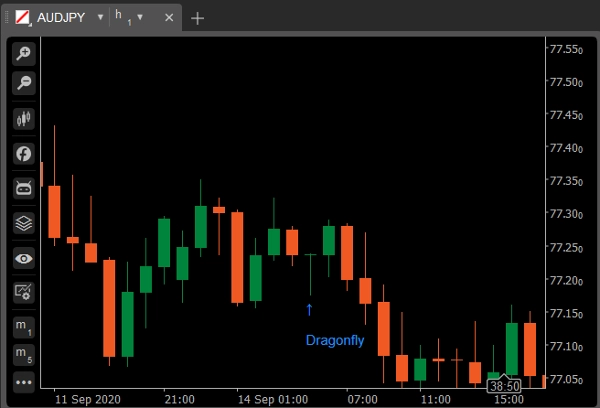
Variation : Doji libellule
Un doji pierre tombale se produit lorsque les prix bas, ouverture et clôture sont (presque) les mêmes, et que le chandelier a une longue ombre supérieure. La pierre tombale ressemble à un "T" inversé. Les implications pour la pierre tombale sont les mêmes que pour la libellule. Les deux indiquent des retournements de tendance possibles mais doivent être confirmés par le chandelier suivant.
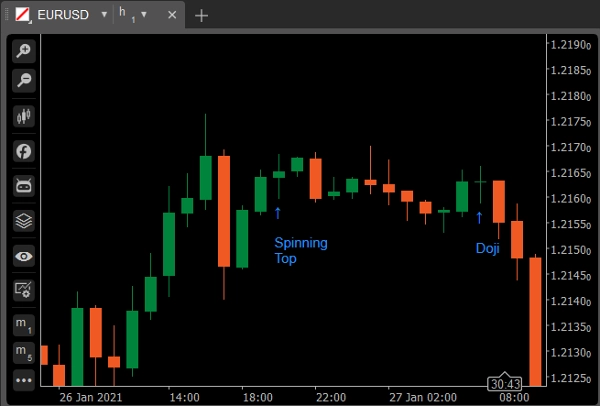
Spinning Top
Un spinning top est un motif de chandelier avec un petit corps réel centré verticalement entre de longues ombres supérieures et inférieures. Le motif de chandelier représente une indécision quant à la direction future de l'actif. Ni les acheteurs ni les vendeurs n'ont pu prendre l'avantage. Le seuil du corps est au maximum de 20 % de la longueur totale.
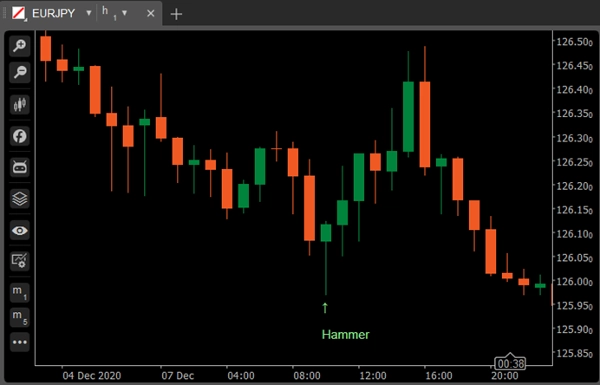
Hammer
Hammer Un chandelier vert ou rouge composé d'un petit corps près du haut avec peu ou pas d'ombre supérieure et une longue queue inférieure. Considéré comme un motif haussier lors d'une tendance baissière.
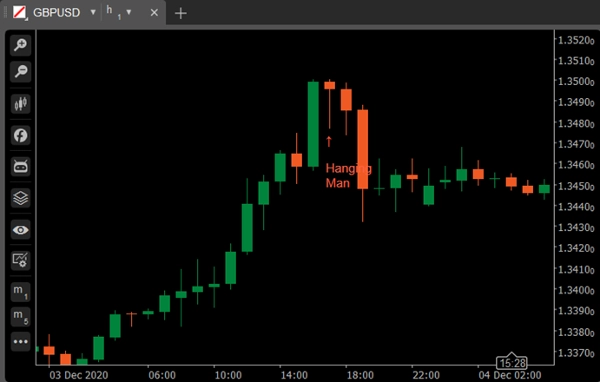
Variation : Hanging Man
Un chandelier vert ou rouge composé d'un petit corps près du haut avec peu ou pas d'ombre supérieure et une longue queue inférieure. Considéré comme un motif baissier lors d'une tendance haussière.
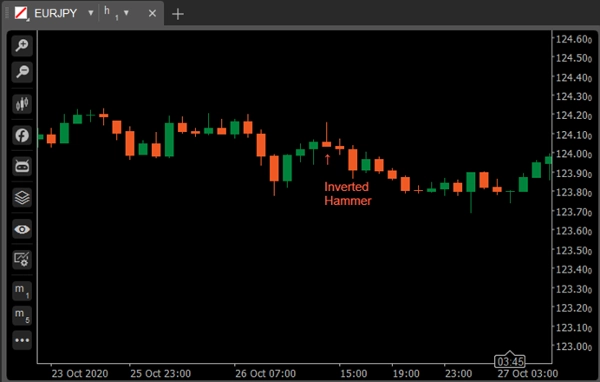
Inverted Hammer
Le marteau inversé est un type de motif de chandelier trouvé après une tendance baissière et est généralement considéré comme un signal de retournement de tendance.
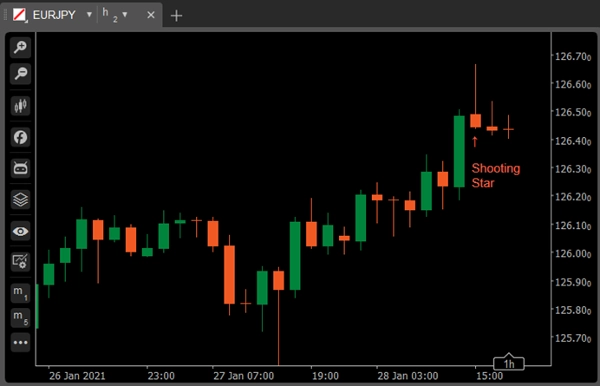
Variation : Shooting Star
Le Shooting Star ressemble exactement au marteau inversé, mais au lieu d'être trouvé dans une tendance baissière, il se trouve dans une tendance haussière et a donc des implications différentes.
Marubozu
Un chandelier long ou normal (rouge ou vert) sans ombre ni queue. Le haut et le bas représentent les prix d'ouverture et de clôture. Considéré comme un motif de continuation.
Variation : Marubozu Open
Pour le Marubozu open, le prix d'ouverture doit être plat : c'est-à-dire que l'action des prix doit se déplacer dans une seule direction, mais contrairement au chandelier Marubozu complet, le prix de clôture de l'autre côté peut légèrement différer du haut/bas. En d'autres termes, l'ouverture doit être plate, tandis qu'il y a de la place pour une petite mèche de l'autre côté.
Variation : Marubozu Close
Le chandelier Marubozu close est l'opposé du Marubozu open : la clôture doit être plate tandis que l'action des prix peut légèrement bouger dans l'autre direction avant de commencer à trader agressivement dans une direction.
Bullish Engulfing
Consiste en un petit corps rouge contenu dans le grand chandelier vert suivant. Lorsqu'il apparaît en bas, il est interprété comme un signal majeur de retournement.
Bearish Engulfing
Consiste en un petit corps vert contenu dans le grand chandelier rouge suivant. Lorsqu'il apparaît en haut, il est considéré comme un signal majeur de retournement.
Piercing Line
Piercing Line consiste en un chandelier rouge suivi d'un chandelier vert qui ouvre plus bas que le bas du précédent mais clôture à plus de la moitié du corps rouge. Il est considéré comme un signal de retournement lorsqu'il apparaît en bas.
Dark Shadow Cover
Consiste en un long chandelier vert suivi d'un chandelier rouge qui ouvre au-dessus du haut du chandelier vert et clôture bien à l'intérieur du corps du chandelier vert. Il est considéré comme un signal de retournement baissier lors d'une tendance haussière.
Bullish Harami
Consiste en un corps rouge exceptionnellement grand suivi d'un petit corps vert (contenu dans le grand corps rouge). Il est considéré comme un motif haussier lorsqu'il est précédé d'une tendance baissière.
Variation : Bullish Harami Cross
Un grand corps rouge suivi d'un Doji. Il est considéré comme un signal de retournement lorsqu'il apparaît en bas.
Bearish Harami
Bearish Harami consiste en un corps vert exceptionnellement grand suivi d'un petit corps rouge (contenu dans un grand corps vert). Il est considéré comme un motif baissier lorsqu'il est précédé d'une tendance haussière.
Variation : Bearish Harami Cross
Un grand corps vert suivi d'un Doji. Considéré comme un signal de retournement lorsqu'il apparaît en haut.
Bullish/Bearish Kicker
Le signal Bullish Kicker se produit souvent après une grande surprise dans les nouvelles annoncées avant ou après les heures de marché. Quelque chose de drastique s'est produit, provoquant un grand changement dans le sentiment des investisseurs, et un retournement suivra inévitablement. Plus l'écart entre les deux chandeliers est grand, plus le signal est significatif.
Morning/Evening Star
Consiste en un grand chandelier vert suivi d'un petit corps (rouge ou vert) qui fait un gap au-dessus du précédent. Le troisième est un chandelier à corps rouge qui clôture bien à l'intérieur du grand corps vert. Il est considéré comme un signal de retournement lorsqu'il apparaît au niveau supérieur.
Variation : Abandoned Baby
Three Green Soldiers/Three Red Crows
Consiste en trois longs chandeliers verts avec des clôtures consécutivement plus hautes. Les prix de clôture sont proches ou au plus haut. Lorsqu'il apparaît en bas, il est interprété comme un signal de retournement de bas.
Consiste en trois longs chandeliers rouges avec des clôtures consécutivement plus basses. Les prix de clôture sont proches ou au plus bas. Lorsqu'il apparaît en haut, il est considéré comme un signal de retournement de haut.
Three Line Strike
Un three line strike est un groupe de chandeliers de continuation qui comprend trois dans la direction d'une tendance suivis d'un dernier chandelier qui revient au point de départ. Les traders utilisent le three line strike comme une opportunité d'acheter à un creux récent de tendance ou de vendre à un sommet récent.
Two Red Gapping
Le motif de continuation baissier two red gapping apparaît après un sommet notable dans une tendance haussière, avec un gap à la baisse qui produit deux barres rouges affichant des creux plus bas. Ce motif prédit que la baisse continuera vers des creux encore plus bas.
Résumé
Avis clients
5 | 100 % | |
4 | 0 % | |
3 | 0 % | |
2 | 0 % | |
1 | 0 % |


