
Description
Indice de Négociabilité Multi-Échelles
L’Indice de Négociabilité Multi-Échelles est un analyseur avancé des conditions de marché qui identifie quand le marché est statistiquement favorable au trading. Au lieu de générer des signaux d’achat ou de vente, il mesure à quel point les conditions actuelles du marché sont négociables sur plusieurs échelles de temps, vous permettant de vous concentrer uniquement sur les périodes où l’action des prix est claire, directionnelle et capable de produire des mouvements significatifs.
Contrairement aux indicateurs traditionnels qui reposent sur des seuils fixes, cet indicateur s’adapte continuellement à chaque échelle de temps en comparant le comportement actuel du marché avec sa propre base historique. Cette approche d’auto-calibrage lui permet de fonctionner sur le Forex, les indices, les matières premières, les cryptomonnaies et d’autres marchés CFD sans nécessiter d’optimisation manuelle.
Comment ça fonctionne
L’indicateur évalue six caractéristiques indépendantes du marché sur chaque échelle de temps.
Tendance versus aléa à l’aide de l’Indice de Médiocrité du Marché.
Lissage versus hachures à l’aide de la Dimension Fractale.
Rapport signal sur bruit pour déterminer si les oscillations significatives dominent les fluctuations aléatoires.
Propreté de la tendance en mesurant l’efficacité des mouvements de prix au lieu de retournements constants.
Fréquence des opportunités de trading en comptant les jambes d’oscillation significatives.
Progrès directionnel net pour déterminer si le prix progresse de manière significative plutôt que de retracer continuellement.
Chaque facteur est normalisé par rapport à son propre comportement historique à l’aide d’une analyse statistique du score z. Cela signifie que l’indicateur évalue si les conditions actuelles sont exceptionnellement favorables plutôt que simplement au-dessus ou en dessous d’un seuil arbitraire.
Les facteurs normalisés sont combinés en un score pondéré allant de 0 à 100.
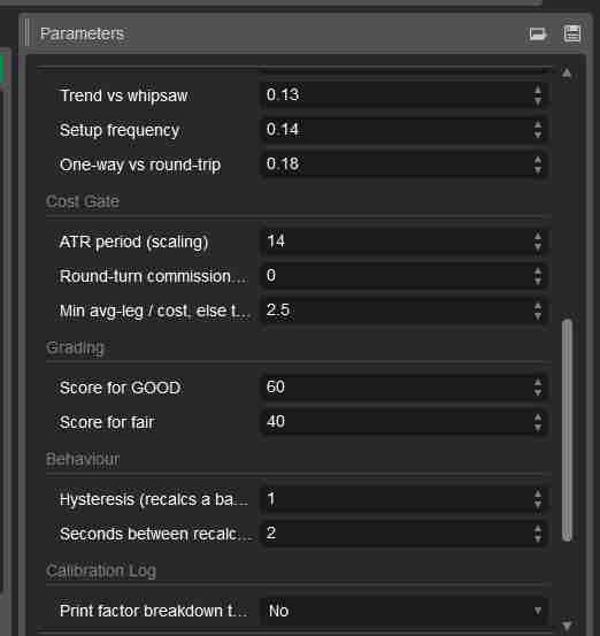
L’indicateur inclut également un filtre de coût de transaction qui empêche les échelles de temps courtes d’obtenir des scores élevés lorsque les oscillations de prix moyennes sont trop faibles pour compenser de manière réaliste les spreads et commissions.
Tableau de bord
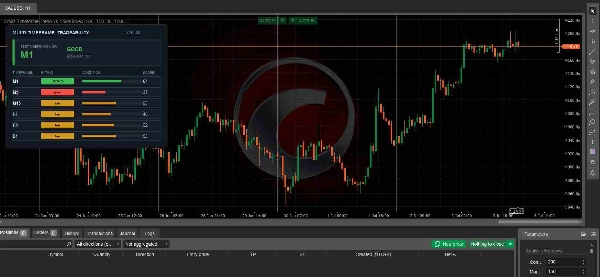
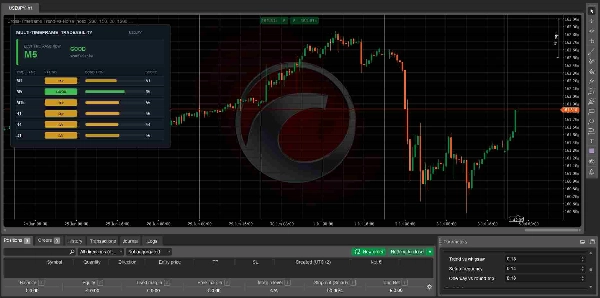
Le tableau de bord analyse six échelles de temps simultanément.
M1
M5
M15
H1
H4
D1
Chaque échelle de temps reçoit l’une des trois évaluations.
BON indique des conditions de marché très favorables.
MOYEN indique des conditions acceptables mais moins idéales.
MAUVAIS indique que la structure du marché est actuellement défavorable.
L’indicateur met automatiquement en évidence l’échelle de temps avec le score le plus élevé ainsi que son score de négociabilité actuel.
Interprétation des scores
80 à 100 indique des conditions de trading exceptionnelles avec un mouvement directionnel fort et un faible bruit de marché.
60 à 79 indique des conditions très bonnes où les stratégies de trading sont susceptibles de bien fonctionner.
40 à 59 indique des conditions moyennes où la sélectivité est recommandée.
En dessous de 40 indique une mauvaise structure de marché avec un excès d’aléa, de hachures ou un mouvement insuffisant.
Des scores plus élevés ne prédisent pas la direction du marché. Ils indiquent simplement que la direction qui se développe est statistiquement plus susceptible de produire une action des prix plus propre et plus négociable.
Paramètres principaux
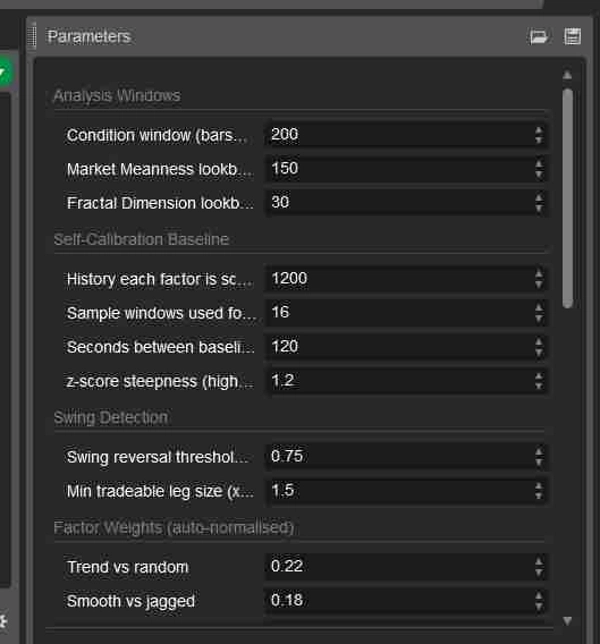
Les fenêtres d’analyse contrôlent la quantité d’historique de marché utilisée pour calculer chaque facteur.
La ligne de base d’auto-calibrage détermine comment la normalisation historique est effectuée.
La détection des oscillations ajuste la sensibilité utilisée pour identifier les oscillations de prix significatives.
Les poids des facteurs permettent aux utilisateurs avancés de mettre en avant ou de réduire l’importance de chaque caractéristique du marché.
Le seuil de coût contrôle la manière dont les coûts de transaction affectent agressivement la note finale.
Les réglages de notation définissent les seuils de score pour les classifications BON et MOYEN.
Les réglages du tableau de bord permettent un contrôle complet de la taille du panneau et de la position à l’écran.
Meilleures utilisations
Trouver l’échelle de temps la plus négociable avant de chercher des entrées.
Éviter les conditions de marché latérales, bruyantes ou de faible qualité.
Filtrer les signaux des stratégies de trading existantes.
Améliorer le trading discrétionnaire en se concentrant uniquement sur des environnements statistiquement favorables.
Soutenir les systèmes algorithmiques avec un filtre adaptatif des conditions de marché.
À qui s’adresse-t-il
Cet indicateur convient aux débutants qui souhaitent une orientation objective sur les moments où les conditions de marché sont favorables, ainsi qu’aux traders discrétionnaires et algorithmiques expérimentés à la recherche d’un filtre adaptatif de qualité de marché fonctionnant sur plusieurs instruments et échelles de temps.
Notes importantes
Cet indicateur n’est pas un générateur de signaux d’achat ou de vente.
Il ne prédit pas la direction future des prix.
Il mesure uniquement la qualité des conditions de marché actuelles.
Pour de meilleurs résultats, combinez-le avec votre stratégie existante d’entrée, de sortie et de gestion des risques. Les trades à la probabilité la plus élevée se produisent généralement lorsque votre propre configuration de trading s’aligne avec des échelles de temps recevant une note de négociabilité BONNE.
Résumé
The indicator provides a weighted Tradeability Score from 0 to 100 for six timeframes (M1, M5, M15, H1, H4, D1), classifying each as GOOD, FAIR, or POOR based on current market quality. It includes a transaction cost filter to account for realistic trading conditions on shorter timeframes. The dashboard highlights the highest scoring timeframe and its score, helping traders focus on periods with clean, directional price action suitable for trading.
This tool does not generate buy or sell signals nor predict price direction; instead, it serves as a market quality filter to improve discretionary or algorithmic trading by signaling when conditions are statistically favorable. Key parameters allow customization of analysis windows, swing detection sensitivity, factor weights, and grading thresholds. It is suitable for traders seeking objective guidance on market structure and tradeability across multiple instruments and timeframes.