Description
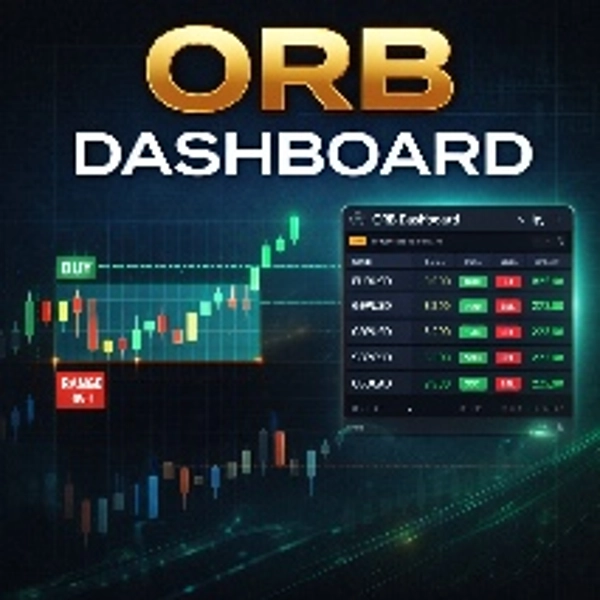
Transformez votre trading avec notre Indicateur ATR-Amélioré ORB (Ouverture Range Breakout) !
C'est un système de trading professionnel complet qui détecte automatiquement les opportunités de breakout à haute probabilité tout en ajustant dynamiquement la gestion des risques en fonction de la volatilité réelle du marché.
Comment ça fonctionne :
Étape 1 : Détection intelligente de la plage d'ouverture
- Identifie automatiquement la période critique de la plage d'ouverture (OR) (heures configurables)
- Calcule les limites précises haut/bas que surveillent les traders institutionnels
- Trace des extensions visuelles claires pour faciliter le trading tout au long de la session
Étape 2 : Système de confirmation de breakout
- Attend des clôtures consécutives au-dessus/en dessous des limites OR (1-10 barres configurables)
- Élimine les faux breakouts grâce à une logique de confirmation éprouvée
- Affiche des flèches de trade professionnelles uniquement lorsque les conditions sont remplies
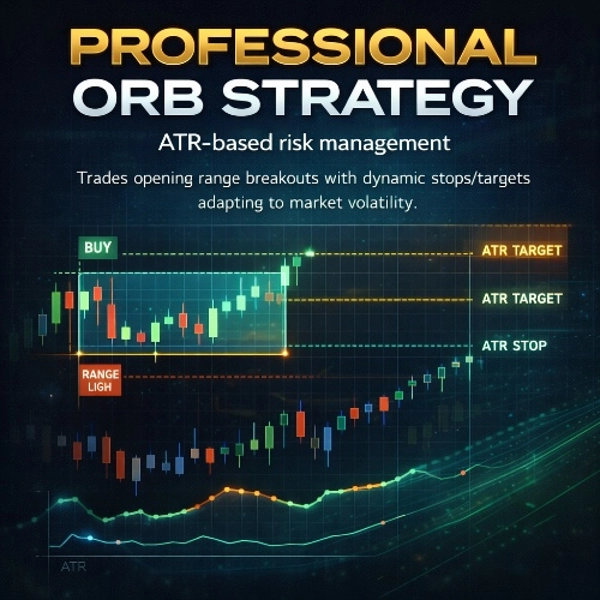
Étape 3 : Gestion des risques adaptative ATR
- Stops dynamiques : Ajuste automatiquement le stop loss en fonction de l'ATR actuel (Average True Range)
- Objectifs intelligents : Définit les niveaux de take profit en utilisant des multiplicateurs ATR (ratio de 1:1,5 à 1:5)
- Adaptation à la volatilité : Stops serrés sur les marchés calmes, stops plus larges sur les marchés volatils
- Protection minimale : Ne place jamais les stops en dessous de la distance minimale de pips définie
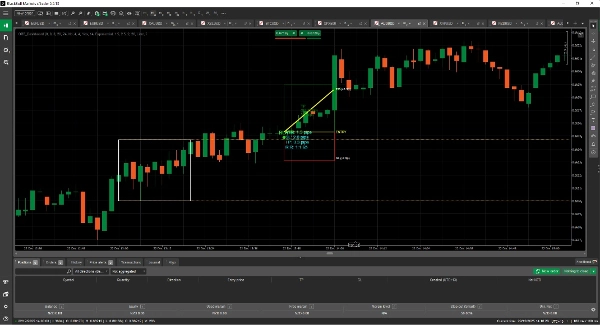
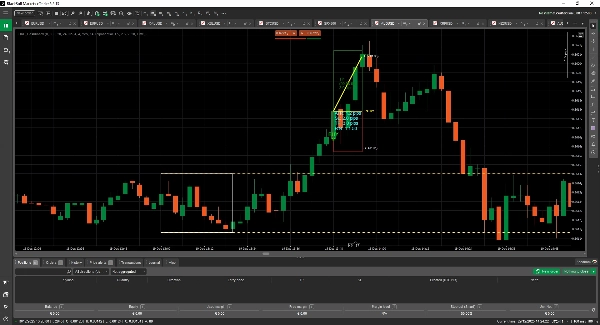
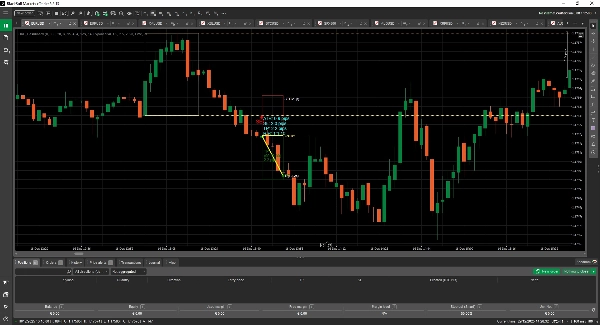
Étape 4 : Visualisation complète des trades
- Zones TP/SL codées par couleur (Vert pour profit, Rouge pour stop)
- Affichage en temps réel de la valeur ATR avec calculs de pips
- Ratio risque-rendement affiché sur chaque trade
- Suivi des résultats des trades (TP/SL) avec durée et pips gagnés
Caractéristiques clés qui vous font gagner de l'argent :
✅ Intégration ATR de qualité professionnelle
- Les stops/objectifs s'ajustent automatiquement aux conditions du marché
- Fini les suppositions pour placer vos stops !
- Adapté à toutes les unités de temps (M1 à Daily)
✅ Pas de repaint, pas de redessin
- Les signaux apparaissent uniquement lorsqu'ils sont confirmés
- Pas de flèches disparaissant ou de faux signaux
- Les trades restent visibles pour analyse
✅ Tableau de bord visuel complet
- Lignes haut/bas de la plage d'ouverture avec extensions
- Marqueurs d'entrée/sortie de trade avec étiquettes
- Statistiques de performance sur chaque trade
- Présentation propre et professionnelle du graphique
✅ Gestion intelligente des trades
- Un trade par période OR (évite le sur-trading)
- Détection automatique des hits TP/SL
- Suivi des résultats et statistiques des trades
- Trajectoire visuelle du trade de l'entrée à la sortie
✅ Entièrement personnalisable
- Ajustez les heures OR à n'importe quelle session de marché
- Modifiez les exigences de confirmation
- Personnalisez les multiplicateurs et la période ATR
- Changez les couleurs et les paramètres visuels
Pour qui est-ce :
🔹 Traders Swing - Saisissez les breakouts majeurs quotidiens avec une gestion professionnelle des risques
🔹 Traders Day - Tradez les breakouts de la plage d'ouverture sur des unités de temps plus courtes
🔹 Traders averses au risque - Laissez l'ATR déterminer votre risque, pas vos émotions
🔹 Traders algorithmiques - Utilisez-le comme générateur de signaux pour systèmes automatisés
🔹 Formateurs en trading - Outil parfait pour enseigner la stratégie ORB et la gestion des risques
Pourquoi acheter notre indicateur plutôt que de créer le vôtre ?
- Logique éprouvée - Années d'affinement de la logique d'entrée/sortie
- Intelligence ATR - Dimensionnement sophistiqué des positions basé sur la volatilité
- Prêt pour la production - Sans bugs, testé sur plusieurs marchés
- Gain de temps - Des centaines d'heures de développement pour une fraction du coût
- Support inclus - Mises à jour régulières et support technique
Exigences techniques :
- Fonctionne sur la plateforme cTrader
- Compatible avec toutes les paires de devises et unités de temps
- Faible utilisation CPU pour fonctionnement multi-graphiques
- Aucune dépendance externe requise
Avertissement sur les risques :
Ceci est un outil, pas une garantie de profits. Les performances passées ne garantissent pas les résultats futurs. Pratiquez toujours une gestion appropriée des risques et testez les stratégies sur des comptes démo en premier.
Résumé
Risk management adapts dynamically using the Average True Range (ATR) to set stop-loss and take-profit levels, adjusting for market volatility with customizable ATR multipliers and minimum stop distances. The dashboard provides real-time ATR values, color-coded profit and stop zones, risk-reward ratios, and tracks trade outcomes including duration and pips gained.
Key features include no repaint or redraw signals, one trade per opening range period to prevent over-trading, automatic trade outcome detection, and comprehensive visual trade management. The indicator is fully customizable for opening range hours, confirmation bars, ATR settings, and visual appearance. It supports all currency pairs and timeframes from 1 minute to daily, with low CPU usage and no external dependencies.
ORB_Dashboard suits swing traders, day traders, risk-averse traders, algorithmic traders, and educators seeking a refined ORB strategy with integrated volatility-based risk controls.
Avis clients
5 | 50 % | |
4 | 50 % | |
3 | 0 % | |
2 | 0 % | |
1 | 0 % |