
Description
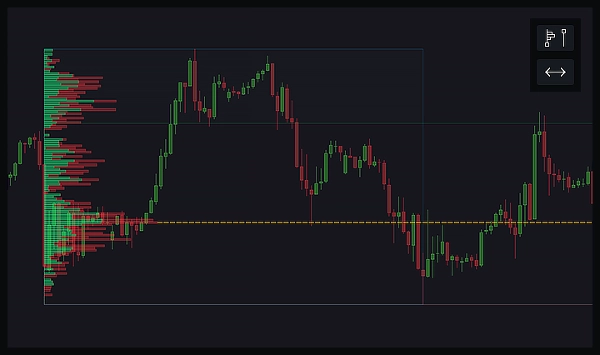
Un profil de volume à plage fixe est un outil qui montre combien d'activité de trading a eu lieu à différents niveaux de prix dans une plage spécifique sur un graphique. Vous dessinez un rectangle sur la zone qui vous intéresse, et le profil affiche des barres horizontales indiquant le volume des transactions à chaque niveau de prix dans cette plage. Cela vous aide à voir où l'achat et la vente ont été les plus importants, mettant en évidence les niveaux de prix clés qui pourraient être importants pour prendre des décisions de trading.
Les composants clés du profil de volume à plage fixe incluent :
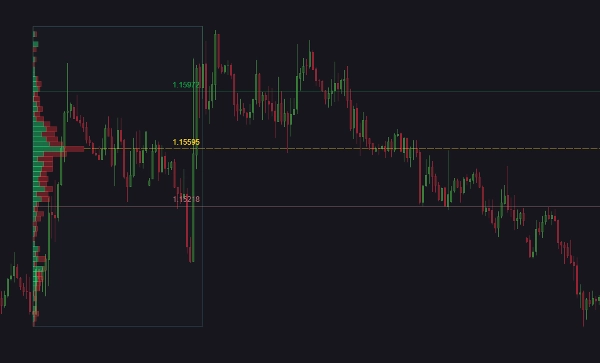
- Point de Contrôle (POC) : Le niveau de prix avec le volume de trading le plus élevé dans la plage sélectionnée. C'est souvent considéré comme un niveau de support ou de résistance significatif car il reflète un prix où beaucoup d'activité de trading a eu lieu.
- Valeur Haute (VAH) : La limite supérieure de la plage de prix où 70 % du volume total des transactions a eu lieu. Les prix au-dessus de ce niveau sont considérés comme moins échangés et potentiellement surévalués.
- Valeur Basse (VAL) : La limite inférieure de la plage de prix où 70 % du volume total des transactions a eu lieu. Les prix en dessous de ce niveau sont considérés comme moins échangés et potentiellement sous-évalués.
Ces lignes aident les traders à identifier des niveaux de prix significatifs qui peuvent agir comme support ou résistance. En comprenant où se concentre la majeure partie du volume de trading, les traders peuvent prendre des décisions plus éclairées sur les mouvements potentiels des prix, les points d'entrée et de sortie.
Par exemple, si le prix actuel est proche du POC, cela peut indiquer un niveau de support ou de résistance fort. Si le prix est dans la zone de valeur, cela suggère qu'il est dans une fourchette de valeur équitable, tandis que les prix en dehors de la zone de valeur peuvent être considérés comme des points potentiels de rupture ou de cassure.
Ce que fait cet indicateur :
Cet indicateur améliore votre graphique de trading avec une analyse puissante du profil de volume et des alertes personnalisables. Avec deux boutons intuitifs, vous pouvez facilement dessiner des profils de volume à plage fixe et étendre ou contracter les niveaux clés à l'infini. Le profil de volume peut être visualisé en deux modes différents, total ou barres montantes et descendantes. Ajustez le nombre de niveaux, la résolution des données (Précise ou Rapide), et la taille de la zone de valeur selon vos besoins.
Les plages magnétiques se mettent automatiquement à jour en fonction de la dernière bougie, garantissant que votre analyse reste actuelle. Vous pouvez également personnaliser l'apparence et le comportement du profil et de ses composants, y compris les lignes POC, VAH et VAL. Des alertes peuvent être configurées pour les touches de prix, avec des options pour déclencher des actions comme démarrer ou arrêter des cBots, et fermer des positions. Les alertes peuvent être envoyées via son, pop-ups cTrader, messages Telegram (avec captures d'écran optionnelles) et emails.
Fonctionnalités :
- Profil de volume à plage fixe : Dessinez un rectangle pour visualiser le profil de volume d'une plage sélectionnée.
- Étendre/Contracter les lignes : Étendez ou contractez les lignes POC, VAH et VAL à l'infini.
- Modes de profil de volume : Choisissez entre volume total ou barres montantes et descendantes.
- Niveaux et résolution personnalisables : Sélectionnez le nombre de niveaux et la résolution (Précise ou Rapide).
- Zone de valeur ajustable : Définissez la taille de la zone de valeur.
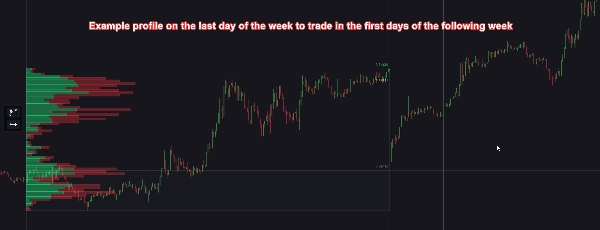
- Plages magnétiques : Redimensionnez automatiquement les plages pour s'aligner avec la dernière bougie, mise à jour toutes les 1 à 10 minutes ou à la clôture de la barre.
- Apparence personnalisable : Changez la position, la taille et le style des boutons, des lignes et des barres de volume.
- Alertes pour les touches de prix : Soyez notifié lorsque le prix touche les lignes POC, VAH ou VAL.
- Intégration cBot : Démarrez ou arrêtez des cBots en fonction des alertes.
- Gestion des positions : Fermez les positions lorsque des alertes se produisent, avec des options personnalisables pour chaque ligne (POC, VAH et VAL).
- Méthodes d'alerte : Recevez des alertes via son, pop-ups cTrader, messages Telegram (avec captures d'écran optionnelles) et emails.
- Optimisation des performances : Option pour supprimer automatiquement les plages passées non visibles sur le graphique afin d'améliorer les performances.
- Contrôle global des alertes : Activez ou désactivez facilement toutes les alertes de cet indicateur.
- Guide de l'utilisateur : Vous pouvez facilement ouvrir le guide de l'utilisateur de cet indicateur via un petit bouton sur le graphique.
Résumé
Avis clients
5 | 67 % | |
4 | 0 % | |
3 | 33 % | |
2 | 0 % | |
1 | 0 % |


