
VegaXLR - cTrader Chart Themes
Indicateur
336 téléchargements
Version 1.1, Nov 2025
Windows, Mac
5.0
Avis : 3
Description
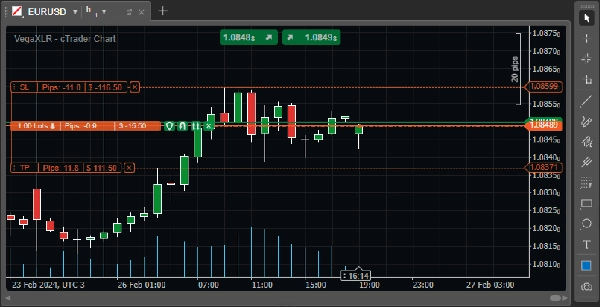
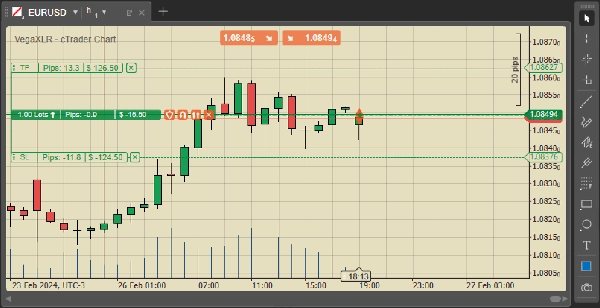
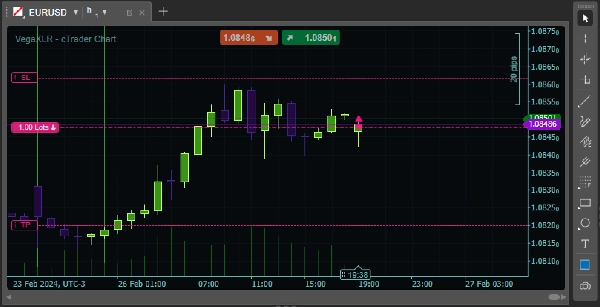
Ceci est un pack gratuit de thèmes de graphiques cTrader. Ces thèmes ne modifieront pas les configurations de vos modèles de graphiques, ils ne changeront que les couleurs du graphique.
Comment appliquer :
- Installez le fichier comme n'importe quel autre indicateur — il suffit de double-cliquer dessus.
- Ajoutez l'indicateur à votre graphique.
- Sélectionnez votre thème préféré.
- Une fois que vous êtes satisfait du thème, retirez l'indicateur du graphique.
- Enregistrez le thème en tant que modèle de graphique. C'est terminé !
Vous cherchez plus d'outils cTrader ? Consultez la section « Plus de cet auteur » ci-dessous. Vous y trouverez une variété d'indicateurs et de cBots, y compris des alertes de moyenne mobile, un profil de volume à plage fixe, des alertes de ligne de tendance, et bien plus encore !
Résumé
Résumé IA
VegaXLR - cTrader Chart Themes is a free pack of customizable chart color themes designed for the cTrader trading platform. The product allows users to change the visual color scheme of their charts without altering any existing chart template configurations. Installation involves adding the indicator to a chart, selecting a preferred theme, then removing the indicator and saving the theme as a chart template. This tool supports various market types including Forex, Indices, Commodities, Crypto, and Stocks, providing a straightforward way to personalize chart appearance across these markets on cTrader.
Profil de l'indicateur
Avis clients
5.0
Avis : 3
5 | 100 % | |
4 | 0 % | |
3 | 0 % | |
2 | 0 % | |
1 | 0 % |
Avis clients
March 31, 2026
September 18, 2025
Discussion
Questions fréquentes
Prop
Forex
Indices
Commodities
Crypto
Stocks
Les produits disponibles sur cTrader Store, notamment les bots de trading, les indicateurs et les plug-ins, sont fournis par des développeurs tiers et mis à disposition à titre informatif et à des fins d'accès technique uniquement. cTrader Store n'est pas un courtier et ne fournit aucun conseil en investissement, aucune recommandation personnelle ni aucune garantie quant aux performances futures.


Prix
231
Ventes
694
Installations gratuites