
คำอธิบาย
ปฏิวัติการเทรดของคุณด้วยตัวบ่งชี้รูปแบบแผนภูมิ cTrader ที่ดีที่สุด
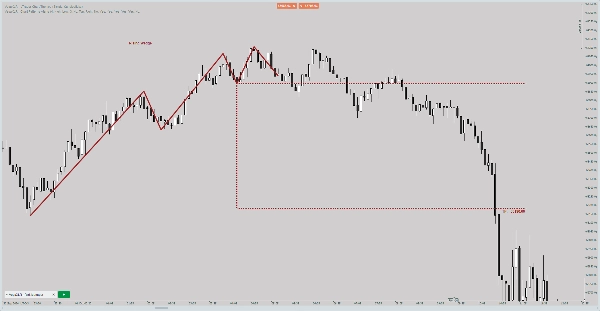
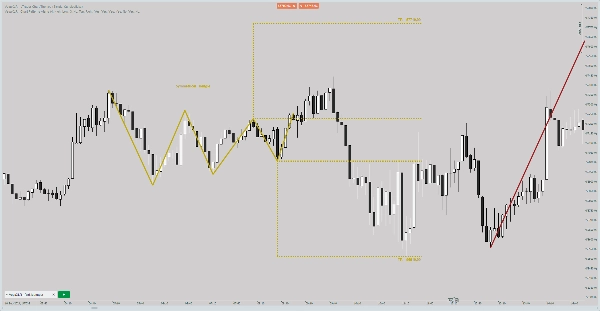
ยกระดับกลยุทธ์การเทรดของคุณไปอีกขั้นด้วย ตัวบ่งชี้ cTrader ที่ทันสมัย ที่ออกแบบมาอย่างเชี่ยวชาญเพื่อค้นหาและเน้น รูปแบบแผนภูมิที่สำคัญ สำหรับการวิเคราะห์ตลาดอย่างแม่นยำ เครื่องมือขั้นสูงนี้ระบุรูปแบบสำคัญ เช่น Double Tops, Head and Shoulders, Ascending Triangles และอื่นๆ มอบข้อได้เปรียบที่ทรงพลังให้กับเทรดเดอร์ใน ฟอเร็กซ์, การเทรดตลาดหุ้น และ ทุกตลาดที่มีในแพลตฟอร์ม cTrader.
คุณสมบัติหลัก:
- การตรวจจับรูปแบบแผนภูมิอัตโนมัติ: ตรวจจับรูปแบบอย่างรวดเร็ว เช่น Bullish Flags, Symmetrical Triangles และ Rising Wedges.
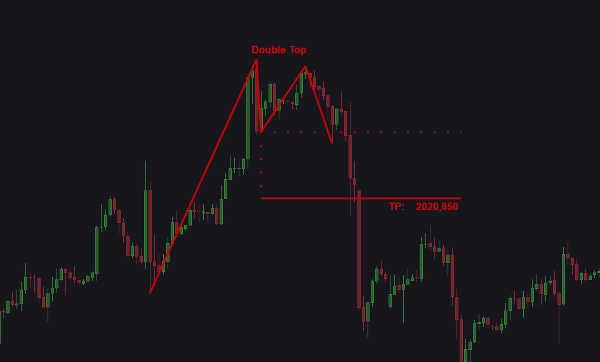
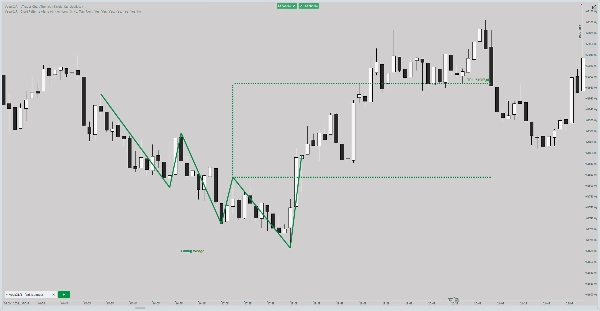
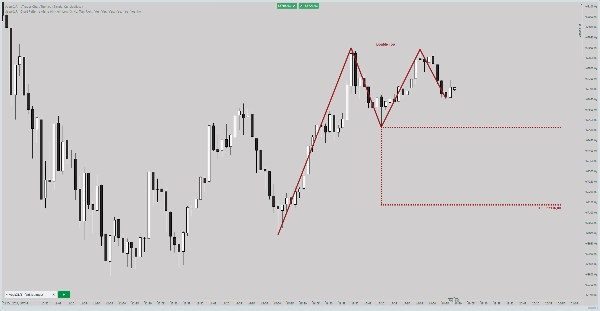
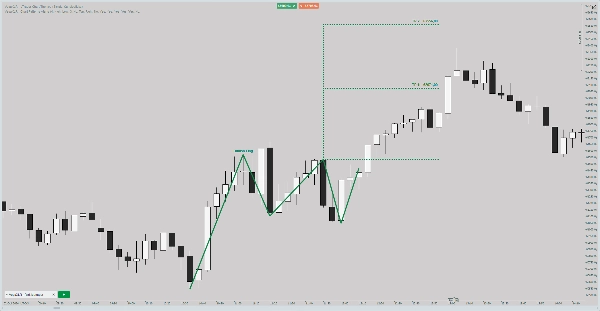
- การวางจุดสวิงของรูปแบบ: แสดงภาพ เส้นคอ, เส้นเป้าหมาย และการเคลื่อนไหวของราคาได้อย่างง่ายดาย
- การแจ้งเตือนที่ปรับแต่งได้: รับข้อมูลแจ้งเตือนผ่าน เสียง, ป๊อปอัป, Telegram หรือ อีเมล—ปรับตามความต้องการของคุณ
- ข้อมูลเชิงลึกที่ใช้สีรหัส: แยกแยะได้อย่างรวดเร็วระหว่าง รูปแบบขาขึ้น, รูปแบบขาลง และ รูปแบบเป็นกลาง โดยใช้ชุดสีที่ปรับแต่งได้
- รายการรูปแบบพร้อมสถิติ: ติดตามการเกิดรูปแบบได้ง่ายด้วยรายการที่รวมย่อและจำนวน
- ระดับการซูมที่ปรับได้: โฟกัสที่ ขนาดรูปแบบ เฉพาะสำหรับการวิเคราะห์อย่างละเอียด
- การแสดงศักยภาพกำไร: ประเมินโอกาสการเทรดด้วยการแสดงขนาดกำไรอย่างชัดเจน
- ความชัดเจนของกรอบเวลาและสัญลักษณ์: การแจ้งเตือนรวมรายละเอียดที่แม่นยำเกี่ยวกับ สัญลักษณ์ และ กรอบเวลา เพื่อการตัดสินใจที่มีข้อมูลครบถ้วน
- ตัวเลือกหยุดการแจ้งเตือน: วิเคราะห์รูปแบบโดยไม่มีสิ่งรบกวนด้วยการหยุดการแจ้งเตือน
- ฟีเจอร์บันทึกของผู้ใช้: เพิ่มความคิดเห็นเพื่อปรับปรุงกลยุทธ์หรือบันทึกรูปแบบเฉพาะ
รูปแบบแผนภูมิที่ตรวจพบ:
- Double Top
- Double Bottom
- Head and Shoulders
- Inverse Head and Shoulders
- Symmetrical Triangle
- Ascending Triangle
- Descending Triangle
- Bullish Flag
- Bearish Flag
- Rising Wedge
- Falling Wedge
ตัวบ่งชี้การเทรดที่ ใช้งานง่ายนี้ ช่วยให้เทรดเดอร์ผสานรวมการ ตรวจจับรูปแบบแผนภูมิอัตโนมัติ, การแจ้งเตือนที่ปรับแต่งได้ และ การแสดงผลแบบเรียลไทม์ ไม่ว่าคุณจะเทรดใน ตลาดฟอเร็กซ์ วิเคราะห์ แผนภูมิตลาดหุ้น หรือสำรวจ ตัวบ่งชี้ที่กำหนดเองของ cTrader เครื่องมือนี้มอบข้อมูลเชิงลึกที่คุณต้องการเพื่อการตัดสินใจที่ชาญฉลาดและมั่นใจยิ่งขึ้น เหมาะสำหรับเทรดเดอร์ที่ต้องการเชี่ยวชาญใน การวิเคราะห์ทางเทคนิค และเพิ่มประสิทธิภาพ กลยุทธ์การจัดการความเสี่ยง ของตน
ปลดล็อกศักยภาพการเทรดของคุณวันนี้ด้วยตัวบ่งชี้ cTrader ที่ครอบคลุมนี้!
คำเตือน:
ตัวบ่งชี้นี้เป็น เครื่องมือวิเคราะห์ทางเทคนิค ที่ออกแบบมาเพื่อช่วยเทรดเดอร์โดยให้ข้อมูลเชิงลึกและการแสดงผลตามรูปแบบแผนภูมิและข้อมูลตลาด มัน ไม่ได้ทำงานเป็นโซลูชันการเทรดอิสระ และไม่รับประกันผลกำไร ผู้ใช้ต้องใช้กลยุทธ์การเทรด การจัดการความเสี่ยง และกระบวนการตัดสินใจของตนเองเมื่อใช้ผลิตภัณฑ์นี้ ผลงานในอดีตไม่ใช่ตัวบ่งชี้ผลลัพธ์ในอนาคต การเทรดในตลาดการเงินมีความเสี่ยงสูง และคุณควรเทรดด้วยเงินทุนที่คุณสามารถเสียได้เท่านั้น
สรุป
Key functionalities include automatic pattern detection, real-time visualization of pattern components like necklines and target lines, and customizable alerts delivered via sound, pop-up, Telegram, or email. It features color-coded insights to distinguish bullish, bearish, and neutral patterns, a pattern list with occurrence statistics, adjustable zoom levels for detailed analysis, and profit potential display to evaluate trade opportunities. Alerts provide clear symbol and timeframe information, and users can pause notifications or add personal notes for strategy refinement.
This tool assists traders in technical analysis and risk management by providing actionable insights based on chart patterns. It is intended as a supportive tool and does not function as a standalone trading solution. Users must apply their own trading strategies and risk controls when using this indicator.
รีวิวจากลูกค้า
5 | 67 % | |
4 | 0 % | |
3 | 33 % | |
2 | 0 % | |
1 | 0 % |


