

VegaXLR - ZigZag Alerts
Chỉ báo
11 lượt mua
Phiên bản 1.0, Feb 2025
Windows, Mac
4.3
Đánh giá: 3

255
Lượt bán
1.43K
Cài đặt miễn phí
Mô tả
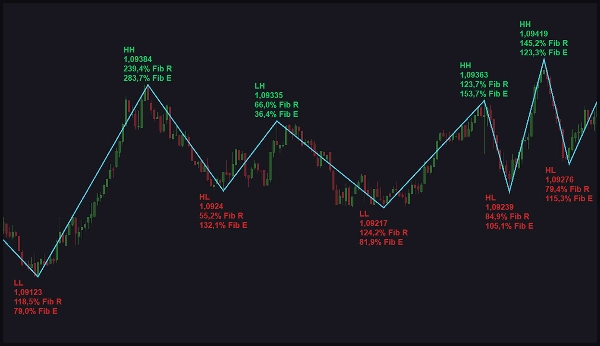
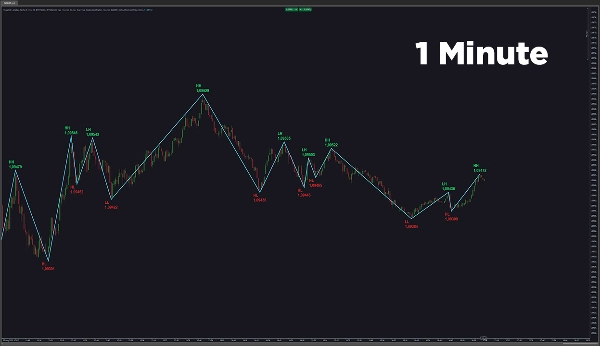
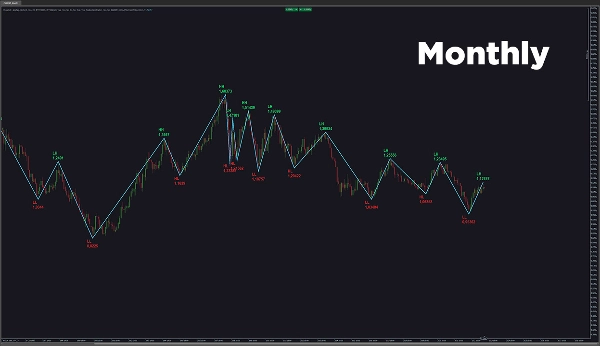
Chỉ báo cTrader ZigZag Alerts giúp bạn theo dõi các biến động giá bằng cách vẽ các Đỉnh Cao Hơn, Đáy Cao Hơn, Đáy Thấp Hơn và nhiều hơn nữa. Nó cũng tính toán các mức thoái lui và mở rộng Fibonacci bằng cách so sánh các biến động. Đường ZigZag giữ nguyên nhất quán trên tất cả các ký hiệu, khung thời gian và phạm vi giá để phân tích đáng tin cậy.
Các Tính Năng Chính:
- Độ Nhạy Có Thể Điều Chỉnh: Tùy chỉnh cách chỉ báo phát hiện các biến động dựa trên điều kiện thị trường.
- Tùy Chọn Nhãn: Chọn giữa nhãn viết tắt hoặc đầy đủ để trực quan rõ ràng.
- Tùy Chỉnh Phông Chữ & Màu Sắc: Thay đổi kích thước chữ và định nghĩa màu tăng/giảm để dễ đọc hơn.
- Nhãn & Giá Biến Động: Hiển thị nhãn biến động cùng với giá tương ứng để có cái nhìn sâu sắc hơn.
- Các Mức Fibonacci: Xem các mức thoái lui và mở rộng Fibonacci để cải thiện điểm vào và ra.
- Quản Lý Cảnh Báo: Tạm dừng tất cả cảnh báo ngay lập tức khi cần.
- Bình Luận Tùy Chỉnh: Thêm bình luận xuất hiện trong cảnh báo để dễ nhận biết.
- Nhiều Tùy Chọn Cảnh Báo: Nhận cảnh báo qua âm thanh, cửa sổ bật lên, Telegram hoặc email.
- Cảnh Báo Riêng Cho Biến Động: Nhận cảnh báo cho các loại biến động đã chọn và tạm dừng cảnh báo trong thời gian định trước.
- Cảnh Báo Fibonacci: Luôn được thông báo với cảnh báo về thoái lui và mở rộng Fibonacci.
- Đường ZigZag Đồng Nhất: Khác với các chỉ báo khác, chỉ báo này duy trì phát hiện biến động đồng nhất trên tất cả khung thời gian và phạm vi giá.
- Hướng Dẫn Sử Dụng: Bạn có thể nhanh chóng truy cập hướng dẫn sử dụng qua nút trên biểu đồ.
cTrader ZigZag Alerts cung cấp phát hiện biến động chính xác và tùy chỉnh cảnh báo, giúp nhà giao dịch đưa ra quyết định thông minh với sự tự tin.
Tóm tắt
Tóm tắt AI
VegaXLR - ZigZag Alerts is a cTrader indicator designed for precise price swing analysis. It identifies and plots key swing points such as Higher Highs, Higher Lows, and Lower Lows, maintaining consistent ZigZag lines across all symbols, timeframes, and price ranges. The indicator calculates Fibonacci retracement and expansion levels by comparing swings, aiding in identifying potential entry and exit points.
Key features include adjustable sensitivity for swing detection tailored to market conditions, customizable label formats (abbreviated or full), and font and color settings to distinguish bullish and bearish swings. Swing labels display corresponding prices for enhanced clarity. Alert management options allow users to pause alerts instantly, add custom comments for easy identification, and receive notifications via sound, pop-ups, Telegram, or email. Alerts can be configured for specific swing types and Fibonacci levels, with the ability to pause alerts temporarily.
A user guide is accessible directly from the chart for quick reference. This indicator supports traders in monitoring market swings and Fibonacci levels with customizable alerts to facilitate informed trading decisions.
Key features include adjustable sensitivity for swing detection tailored to market conditions, customizable label formats (abbreviated or full), and font and color settings to distinguish bullish and bearish swings. Swing labels display corresponding prices for enhanced clarity. Alert management options allow users to pause alerts instantly, add custom comments for easy identification, and receive notifications via sound, pop-ups, Telegram, or email. Alerts can be configured for specific swing types and Fibonacci levels, with the ability to pause alerts temporarily.
A user guide is accessible directly from the chart for quick reference. This indicator supports traders in monitoring market swings and Fibonacci levels with customizable alerts to facilitate informed trading decisions.
Hồ sơ chỉ báo
Đánh giá của khách hàng
4.3
Đánh giá: 3
5 | 33 % | |
4 | 67 % | |
3 | 0 % | |
2 | 0 % | |
1 | 0 % |
Đánh giá của khách hàng
February 15, 2025
Simple but not useless around swing point analysis. The useful part is reviewing reversals, pullbacks and swing zones, with the numbers checked before scaling. I would test 20 swing signals and ignore setups where the stop is wider than the 1.5R target. The level is useful when it supports the market story.
February 14, 2025
February 14, 2025
Fair pick for discipline if the trader wants it helps identify turning points and cleaner structure. It works best as support, not a final decision maker. Swing points look better after 3 pivots, especially when the 0.5 Fib area agrees with structure. the signal still needs broader context.
Thảo luận
Câu hỏi thường gặp
Forex
Các sản phẩm có sẵn trên cTrader Store, bao gồm bot giao dịch, chỉ báo và plugin, được cung cấp bởi các nhà phát triển bên thứ ba và chỉ nhằm mục đích cung cấp thông tin và tiếp cận kỹ thuật. cTrader Store không phải là nhà môi giới và không cung cấp lời khuyên đầu tư, khuyến nghị cá nhân hay bất kỳ đảm bảo nào về hiệu suất trong tương lai.


























Giá
255
Lượt bán
1.43K
Cài đặt miễn phí