present
Daftar dan dapatkan potongan bernilai $50 untuk pembelian pertama anda
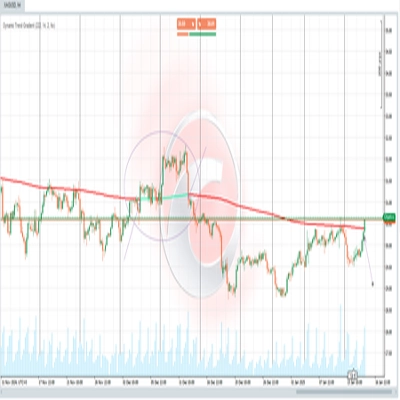
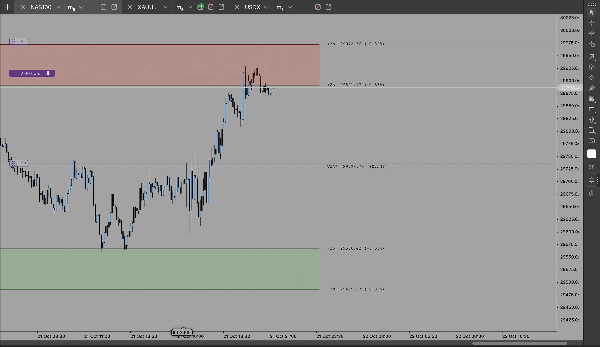
Trading product for VWAPP STRAGEDY Indikator EMA Bollinger Bands, image 1
VWAPP STRAGEDY
Indikator
Versi 1.0, Oct 2026
Windows, Mac
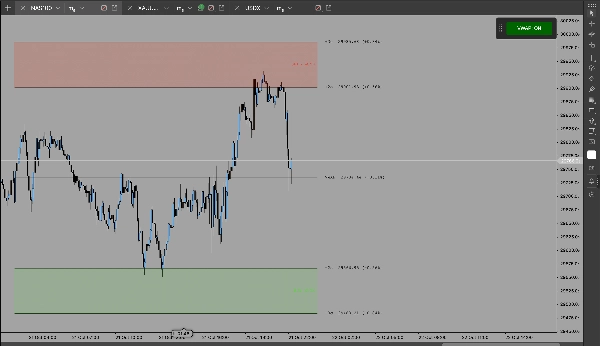
Trading product for VWAPP STRAGEDY Indikator EMA Bollinger Bands, image 2
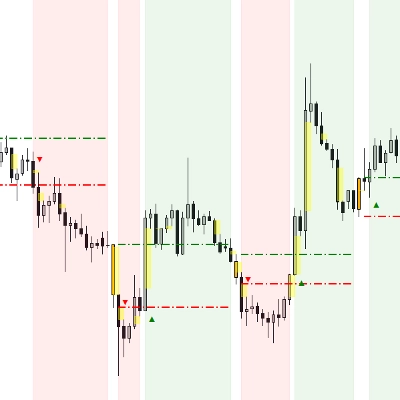
Trading product for VWAPP STRAGEDY Indikator EMA Bollinger Bands, image 3
663.91K
Volum yang didagangkan
1.13K
Pip dimenangi

Penerangan

English – Description

VWAP Bands Indicator for cTrader

This indicator displays the Volume Weighted Average Price (VWAP) along with three upper and three lower standard deviation bands to help traders analyze price movements, market volatility, and potential trading areas.

Key Features

  • VWAP Line: Displays the Volume Weighted Average Price as a reference for the market's average traded price, weighted by volume.
  • Three Standard Deviation Bands: Shows three levels above and below the VWAP to help identify price extensions and potential reversal or continuation areas.
  • Buy and Sell Zones: Highlights potential buying and selling areas based on the indicator's VWAP and band calculations.
  • Price and Percentage Information: Displays relevant price levels and percentage distances to support market analysis.
  • Customizable Settings: Allows users to adjust the indicator's parameters to suit their trading preferences.
  • Draggable ON/OFF Button: Easily enables or disables the entire indicator directly from the chart. The button can be moved to a preferred location.
  • Labels Enabled by Default: Price labels and indicator information are displayed by default, where supported by the selected settings.

How to Use

Use the VWAP line and deviation bands as analytical reference points to evaluate price positioning, volatility, and possible areas of interest. The highlighted zones may help identify potential trading opportunities, but they should be assessed alongside other market information and appropriate risk management.

The indicator is intended as a technical analysis aid. It does not automatically guarantee profitable entries or exits and should not be treated as a standalone trading system.

Risk Disclaimer: This indicator is provided for informational and educational purposes only. It does not guarantee profits or prevent losses. Trading financial markets involves risk, and you are responsible for your own trading decisions. Use this indicator as a support tool for market analysis, not as a guarantee of trading results.

Ringkasan

Profil indikator

Perbincangan

Ulasan pelanggan

0.0
Ulasan: 0
Ulasan pelanggan
Belum ada ulasan untuk produk ini. Anda sudah mencuba produk tersebut? Jadilah yang pertama untuk berkongsi pendapat anda!

Soalan Lazim

EMA
Bollinger Bands
Key Levels
BOS
Order Block
Supply & Demand
VWAP
Produk yang tersedia melalui cTrader Store, termasuk bot dagangan, indikator dan plugin, disediakan oleh pembangun pihak ketiga dan diberikan akses untuk tujuan maklumat dan teknikal sahaja. cTrader Store bukan broker dan tidak memberikan nasihat pelaburan, syor peribadi atau sebarang jaminan prestasi masa hadapan.

Anda juga mungkin suka

Indikator
RSI
VegaXLR's cTrader StochRSI identifies overbought/oversold RSI levels for precise trade entries.
Indikator
ATR
BOS
+5
Opening ranges, dynamic trend channels, and multi-scale breakout/retest analysis for clear intraday chart decisions.
Indikator
ATR
Wedge
+2
Strong Supertrend Turn Market Movement into a Clear Map Market analysis
Indikator
ATR
RSI
+1
Super Trend Rsi ,ATR + trend change distance + dynamic Alpha, divergence/convergence
Indikator
RSI
Signal
+2
Identifies trends with moving averages & volatility. Base levels = bullish 🐂 or bearish 🐻 signals. Reversals detected!
Indikator
Supertrend
Moving Average
Easy Trade: Trend & Breakout Indicator for cTrader
Indikator
BOS
CHOCH
+2
The full SMC suite: BOS / CHoCH / MSS, FVG, liquidity, order blocks and a 0-100 confluence score. No repaint.
Indikator
Key Levels
Spots key hourly ranges and signals breakouts using arrows & colored background zones. Ideal for Gold.
Indikator
ADX
ATR
+5
EMA-cross signals scored on six confluence layers, with an ATR stop, three targets and a live panel
Indikator
Forex
BTCUSD
+6
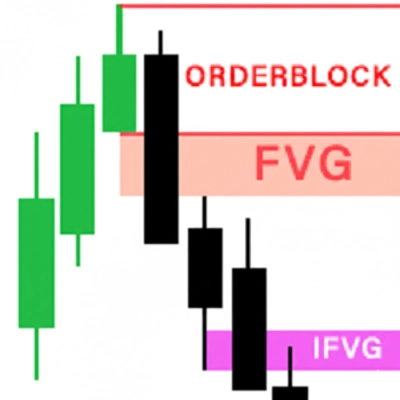
All-In-One solution for ICT's FVG IFVG ORDERBLOCK in advanced mode.
Logo "DrbcLevels"
Dinilai teratas
4.0
(4)
$19
/
$29
Indikator
Key Levels
Break & Retest
+5
Premium Discount Levels - Professional Dealing Range Zones with Draggable Lines, Alerts, Wartermark & Backtest Mode.
Indikator
Prop
Forex
+4
A precision-crafted indicator that compares current volume to its historical average for the same time of day.
Logo "ZigXRay"
Dinilai teratas
4.6
(5)
$29
/
$49
Indikator
CHOCH
Key Levels
+5
ZigZag Market Structure Identifier - Multi-Layer Scanner: Convergent Pivot Detection, 4-TF Overlay & Naked Chart Mode.
Indikator
RSI
Signal
+2
Dynamic circles visualize price's volatility position. Like RSI for market overextension & stretch. Quantify context.
Logo "IVB 2.0"
Dinilai teratas
4.6
(5)
$19
Indikator
IVB 2.0 is an indicator that works on the strategy of imbalance of the maximum volatility box of indices
Indikator
Breakout
FlexSR auto‑detects pivot highs/lows to plot dynamic support & resistance lines Features customizable styling and option
Indikator
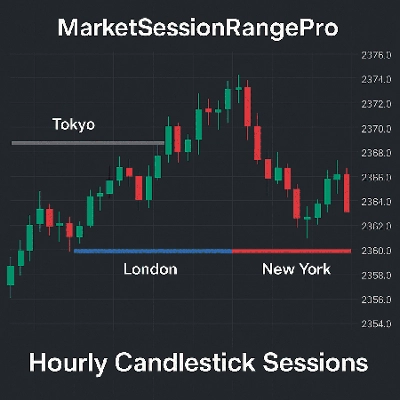
Highlights market sessions & overlaps with real-time range & volume stats – perfect for pro scalpers.
Indikator
Moving Average
Support & Resistance
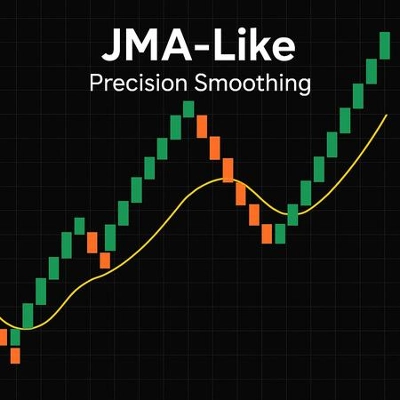
Adaptive, low-lag moving average designed to smooth noise while responding quickly to changing market conditions.

Harga

663.91K
Volum yang didagangkan
1.13K
Pip dimenangi