
Stochastic Momentum Index
지표
1 구매
버전 2.1, Jan 2026
Windows, Mac
4.5
리뷰: 2
설명
확률적 모멘텀 지수(SMI)는 고전적인 확률적 오실레이터보다 모멘텀을 더 부드럽게 측정하도록 설계된 정교한 확률적 오실레이터입니다. 이 cTrader 구현은 상대 범위와 고가-저가 범위 모두에 이중 EMA 평활을 적용하여 일반적으로 사용되는 TradingView 공식과 일치하며, 추세 및 횡보 조건 모두에서 잘 작동하는 깨끗하고 안정적인 모멘텀 곡선을 생성합니다.
표시 내용
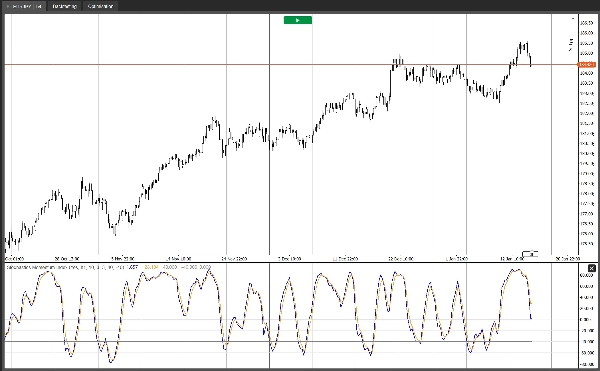
- SMI는 최근 고가-저가 범위의 중간점에 대한 종가의 위치를 정규화하고 스케일링하여 측정합니다.
- 값은 일반적으로 -100에서 +100 사이에서 진동합니다.
- 과매수/과매도 기준 수준(기본값 +40 / -40)은 과도한 상태와 모멘텀 극단을 식별하는 데 도움을 줍니다.
플롯
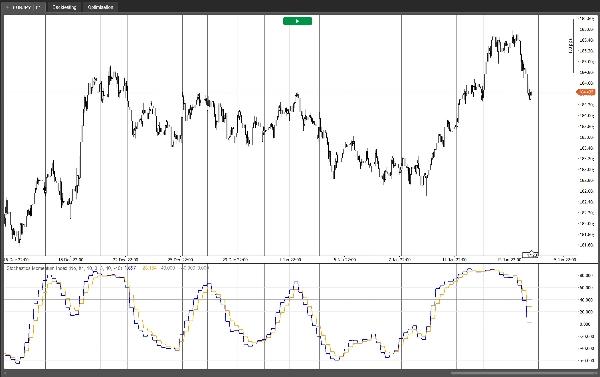
- SMI: 주요 모멘텀 선입니다.
- SMI 기반 EMA: 교차 및 확인을 위한 신호선(SMI의 EMA)입니다.
- 과매수 / 과매도 / 중간(0) 수준으로 빠른 시각적 맥락을 제공합니다.
트레이더들이 사용하는 방법
- 추세 체제: 0선을 방향 필터로 사용합니다(0 이상 = 강세 압력, 0 이하 = 약세 압력) 그리고 추세 방향으로 SMI와 신호선 교차를 통해 되돌림을 거래합니다.
- 평균 회귀 체제: SMI가 과매수/과매도 상태에서 복귀하고 교차로 확인할 때 극단을 반전시키며, 종종 첫 번째 평균 회귀 목표로 0선을 목표로 합니다.
- 발산: 가격과 SMI 간의 모멘텀 발산은 잠재적인 약화 스윙을 강조할 수 있습니다.
다중 시간대 옵션
- 더 높은 시간대에서 SMI를 계산하면서 현재 차트에 표시하기 위해 소스 시간대를 선택합니다(노이즈 필터링 및 신호 품질 향상에 이상적).
- 또는 계산을 현재 시간대에 유지하려면 차트 시간대 사용을 활성화합니다.
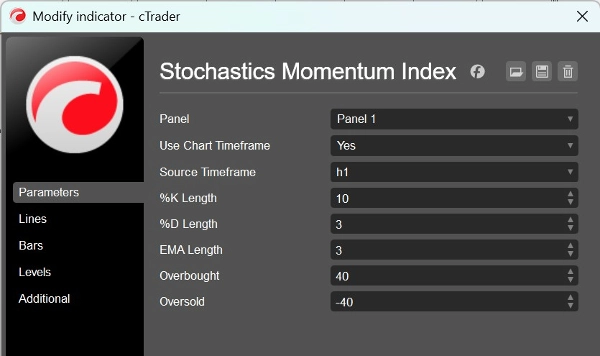
입력값
- %K 길이: 최고가/최저가를 위한 조회 창입니다.
- %D 길이: 이중 EMA 계산에 사용되는 평활 길이입니다.
- EMA 길이: 신호선 길이(SMI의 EMA)입니다.
- 과매수 / 과매도: 기준 수준입니다.
- 차트 시간대 사용 / 소스 시간대: 선택적 상위 시간대 계산입니다.
이 지표는 경량화되고 안정적이며 실제 거래 워크플로에 실용적으로 설계되었습니다—추세 지속, 횡보 거래 또는 더 넓은 전략 내에서 확인 필터로 SMI를 사용하는 경우에도 마찬가지입니다.
요약
AI 요약
The Stochastic Momentum Index (SMI) indicator for cTrader is a refined momentum oscillator that applies double EMA smoothing to both the relative range and high–low range, producing a smooth and stable momentum curve. It measures the position of the close price relative to the midpoint of the recent high–low range, with values oscillating between -100 and +100. Default overbought and oversold levels are set at +40 and -40, respectively, to highlight momentum extremes.
The indicator plots three key elements: the main SMI momentum line, an EMA-based signal line for crossovers and confirmation, and reference levels for overbought, oversold, and the zero midpoint. Traders use the zero line as a directional filter to identify bullish or bearish pressure and trade pullbacks via SMI and signal line crossovers. It also supports mean-reversion strategies by signaling fades from overbought/oversold conditions and can highlight momentum divergences.
A multi-timeframe option allows calculation of the SMI from a higher timeframe while displaying it on the current chart, helping to filter noise and improve signal quality. User inputs include lookback lengths for %K and %D, signal line EMA length, overbought/oversold levels, and timeframe selection. The indicator is designed for use across various markets including Forex, stocks, commodities, indices, and cryptocurrencies.
지표 프로필
고객 리뷰
4.5
리뷰: 2
5 | 50 % | |
4 | 50 % | |
3 | 0 % | |
2 | 0 % | |
1 | 0 % |
고객 리뷰
January 28, 2026
The part worth keeping is the workflow feels calmer, and 2 swing checks is the line to watch.
January 23, 2026
it earns a spot because weak entries have a harder time slipping through, and spread and slippage need a line in the notes.
상담
자주 묻는 질문(FAQ)
BTCUSD
Forex
Signal
Breakout
Indices
EURUSD
Commodities
GBPUSD
NZDUSD
Prop
Scalping
Crypto
Stocks
XAUUSD
NAS100
USDJPY
트레이딩 봇, 지표, 플러그인 등 cTrader Store에서 제공되는 상품은 제3자 개발자에 의해 제공되며, 이는 단순히 정보 및 기술적 접근을 목적으로 제공된 것입니다. cTrader Store는 중개인이 아니며, 투자 조언, 개인별 추천 또는 향후 성과에 대한 어떠한 보장도 제공하지 않습니다.
이 작성자의 상품 더 보기


가격
가입일 31/01/2025
415.05M
거래량
2.69M
핍 수익
4
판매
187
무료 설치