RegressionChannelV2
지표
버전 1.0, Jan 2026
Windows, Mac
5.0
리뷰: 1
설명
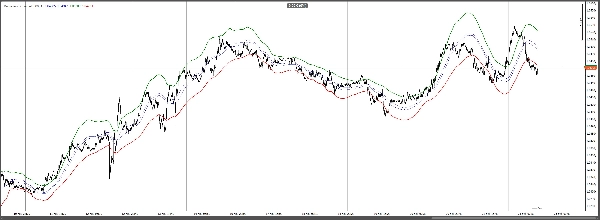
회귀 채널은 가격 주위에 부드러운 채널을 그리는 시각적 추세 및 변동성 도구입니다. 최근 시장 행동을 기반으로 적응형 상한선과 하한선을 계산하여 현재 지배적인 방향을 빠르게 파악하고, 변동성 확장/수축을 측정하며, 잠재적인 과도한 움직임을 식별하는 데 도움을 줍니다.
다음과 같이 사용하세요:
- 추세 방향과 강도 확인
- 채널 가장자리 근처의 평균 회귀 구역 강조
- 가격이 경계를 넘어설 때 돌파 감지
- 기존 신호와 결합하여 진입/퇴출 개선
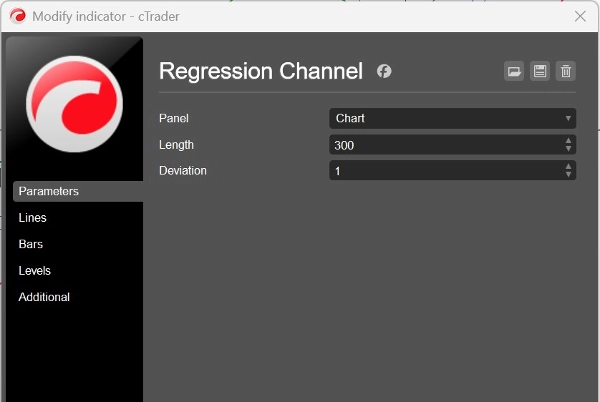
매개변수:
- Length: 채널 계산에 사용되는 조회 창
- Deviation: 채널의 폭을 조절하는 밴드 폭 배수
요약
지표 프로필
고객 리뷰
5.0
리뷰: 1
5 | 100 % | |
4 | 0 % | |
3 | 0 % | |
2 | 0 % | |
1 | 0 % |
고객 리뷰
January 24, 2026
Messy entries become more obvious, but the market context still matters.
상담
자주 묻는 질문(FAQ)
BTCUSD
Forex
Signal
Breakout
Indices
EURUSD
Commodities
GBPUSD
NZDUSD
Prop
Scalping
Crypto
Stocks
XAUUSD
NAS100
USDJPY
트레이딩 봇, 지표, 플러그인 등 cTrader Store에서 제공되는 상품은 제3자 개발자에 의해 제공되며, 이는 단순히 정보 및 기술적 접근을 목적으로 제공된 것입니다. cTrader Store는 중개인이 아니며, 투자 조언, 개인별 추천 또는 향후 성과에 대한 어떠한 보장도 제공하지 않습니다.
이 작성자의 상품 더 보기


!["High-Low Divergence [Iridio Capital]" 로고](https://cdn.ctrader.com/image/webp/443c4661-7abb-40f1-842f-4b6ec560649b_40914)


가격
가입일 31/01/2025
415.05M
거래량
2.69M
핍 수익
4
판매
187
무료 설치