
Mô tả
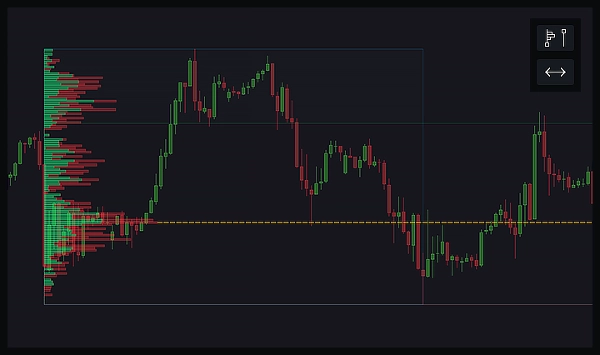
Hồ sơ Khối lượng Phạm vi Cố định là một công cụ cho thấy hoạt động giao dịch diễn ra nhiều như thế nào ở các mức giá khác nhau trong một phạm vi cụ thể trên biểu đồ. Bạn vẽ một hình chữ nhật lên khu vực bạn quan tâm, và hồ sơ sẽ hiển thị các thanh ngang chỉ ra khối lượng giao dịch ở mỗi mức giá trong phạm vi đó. Điều này giúp bạn thấy nơi diễn ra nhiều hoạt động mua bán nhất, làm nổi bật các mức giá quan trọng có thể ảnh hưởng đến quyết định giao dịch.
Các thành phần chính của Hồ sơ Khối lượng Phạm vi Cố định bao gồm:
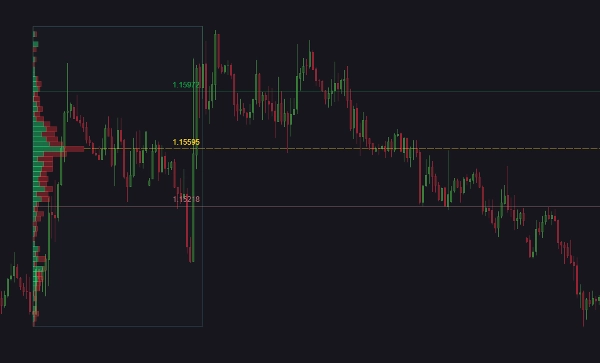
- Điểm Kiểm soát (POC): Mức giá có khối lượng giao dịch cao nhất trong phạm vi đã chọn. Đây thường được xem là mức hỗ trợ hoặc kháng cự quan trọng vì nó phản ánh mức giá nơi diễn ra nhiều hoạt động giao dịch.
- Giá Trị Khu Vực Cao (VAH): Ranh giới trên của phạm vi giá nơi 70% tổng khối lượng giao dịch diễn ra. Giá trên mức này được coi là ít được giao dịch hơn và có thể bị định giá quá cao.
- Giá Trị Khu Vực Thấp (VAL): Ranh giới dưới của phạm vi giá nơi 70% tổng khối lượng giao dịch diễn ra. Giá dưới mức này được coi là ít được giao dịch hơn và có thể bị định giá thấp hơn giá trị thực.
Những đường này giúp các nhà giao dịch xác định các mức giá quan trọng có thể đóng vai trò là hỗ trợ hoặc kháng cự. Bằng cách hiểu nơi tập trung phần lớn khối lượng giao dịch, các nhà giao dịch có thể đưa ra quyết định thông minh hơn về các chuyển động giá tiềm năng, điểm vào và điểm ra.
Ví dụ, nếu giá hiện tại gần với POC, điều đó có thể chỉ ra một mức hỗ trợ hoặc kháng cự mạnh. Nếu giá nằm trong khu vực giá trị, điều đó cho thấy nó đang ở trong phạm vi giá hợp lý, trong khi giá ngoài khu vực giá trị có thể được xem là điểm bứt phá hoặc phá vỡ tiềm năng.
Chức năng của Chỉ báo này:
Chỉ báo này nâng cao biểu đồ giao dịch của bạn với phân tích hồ sơ khối lượng mạnh mẽ và cảnh báo có thể tùy chỉnh. Với hai nút trực quan, bạn có thể dễ dàng vẽ hồ sơ khối lượng phạm vi cố định và mở rộng hoặc thu nhỏ các mức chính đến vô cực. Hồ sơ khối lượng có thể được hiển thị ở hai chế độ khác nhau, tổng hoặc thanh lên và xuống. Điều chỉnh số lượng mức, độ phân giải dữ liệu (Chính xác hoặc Nhanh), và kích thước khu vực giá trị để phù hợp với nhu cầu của bạn.
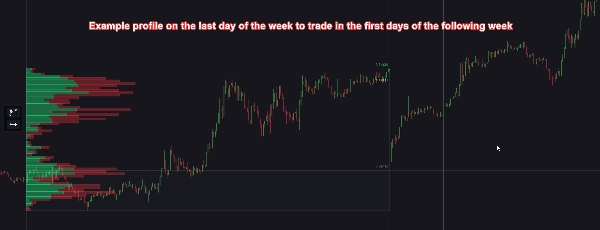
Phạm vi từ tính tự động cập nhật dựa trên cây nến cuối cùng, đảm bảo phân tích của bạn luôn cập nhật. Bạn cũng có thể tùy chỉnh giao diện và hành vi của hồ sơ và các thành phần của nó, bao gồm các đường POC, VAH và VAL. Cảnh báo có thể được thiết lập khi giá chạm, với các tùy chọn kích hoạt hành động như bắt đầu hoặc dừng cBots, và đóng vị thế. Cảnh báo có thể được gửi qua âm thanh, cửa sổ bật lên cTrader, tin nhắn Telegram (kèm ảnh chụp màn hình tùy chọn), và email.
Tính năng:
- Hồ sơ Khối lượng Phạm vi Cố định: Vẽ một hình chữ nhật để trực quan hóa hồ sơ khối lượng của phạm vi đã chọn.
- Mở rộng/Thu nhỏ Đường: Mở rộng hoặc thu nhỏ các đường POC, VAH và VAL đến vô cực.
- Chế độ Hồ sơ Khối lượng: Chọn giữa tổng khối lượng hoặc thanh lên và xuống.
- Mức và Độ phân giải Có thể Tùy chỉnh: Chọn số lượng mức và độ phân giải (Chính xác hoặc Nhanh).
- Khu vực Giá trị Có thể Điều chỉnh: Đặt kích thước khu vực giá trị.
- Phạm vi Từ tính: Tự động điều chỉnh kích thước phạm vi để phù hợp với cây nến cuối cùng, cập nhật mỗi 1–10 phút hoặc khi đóng thanh.
- Giao diện Có thể Tùy chỉnh: Thay đổi vị trí, kích thước và kiểu dáng của các nút, đường và thanh khối lượng.
- Cảnh báo khi Giá Chạm: Nhận thông báo khi giá chạm các đường POC, VAH hoặc VAL.
- Tích hợp cBot: Bắt đầu hoặc dừng cBots dựa trên cảnh báo.
- Quản lý Vị thế: Đóng vị thế khi có cảnh báo, với các tùy chọn tùy chỉnh cho từng đường (POC, VAH và VAL).
- Phương pháp Cảnh báo: Nhận cảnh báo qua âm thanh, cửa sổ bật lên cTrader, tin nhắn Telegram (kèm ảnh chụp màn hình tùy chọn), và email.
- Tối ưu Hiệu suất: Tùy chọn tự động xóa các phạm vi cũ không hiển thị trên biểu đồ để cải thiện hiệu suất.
- Kiểm soát Cảnh báo Toàn cầu: Dễ dàng bật hoặc tắt tất cả cảnh báo từ chỉ báo này.
- Hướng dẫn Sử dụng: Bạn có thể dễ dàng mở hướng dẫn sử dụng của chỉ báo này thông qua một nút nhỏ trên biểu đồ.
Tóm tắt
The indicator offers two visualization modes: total volume or separate up and down volume bars. It features customizable settings for the number of volume levels, data resolution (Precise or Fast), and value area size. Magnetic ranges automatically update based on the latest candle to keep analysis current. Users can expand or contract POC, VAH, and VAL lines infinitely.
Alerts can be configured for price touches on these key levels, with notifications via sound, platform pop-ups, Telegram (including optional screenshots), and email. Alerts can trigger actions such as starting/stopping cBots or closing positions. The indicator also supports customizable appearance, performance optimization by auto-deleting out-of-view ranges, and global alert control. A user guide is accessible directly from the chart interface.
Đánh giá của khách hàng
5 | 67 % | |
4 | 0 % | |
3 | 33 % | |
2 | 0 % | |
1 | 0 % |


![Logo "[Stellar Strategies] Smart ADX"](https://cdn.ctrader.com/image/webp/af13b084-b6f6-41db-b7bc-c7e688b57b05_36929)

