
Mô tả
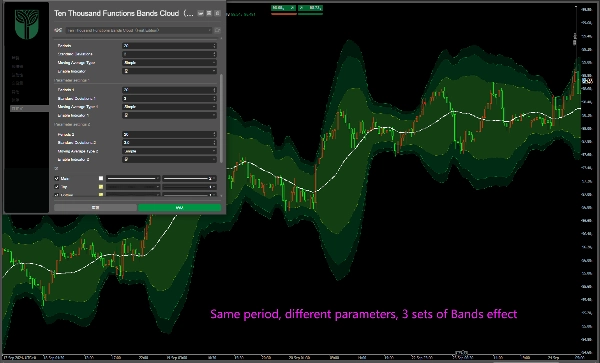
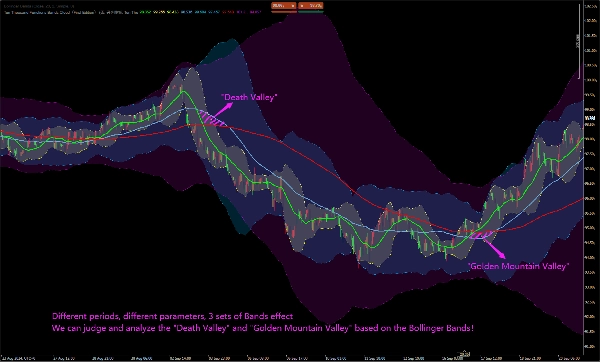
3 nhóm Bands thông thường:
chu kỳ:20
Độ lệch:2.0;3.0; 3.5;
Được trang bị nền mây!
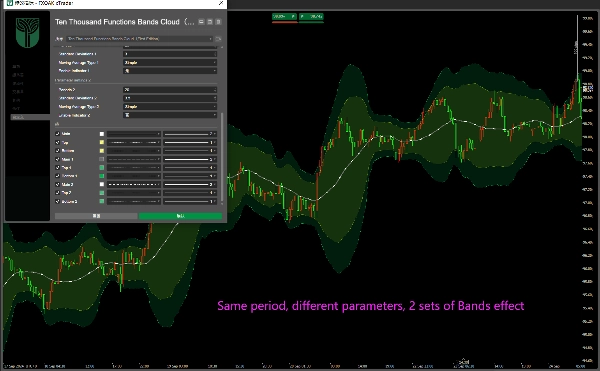
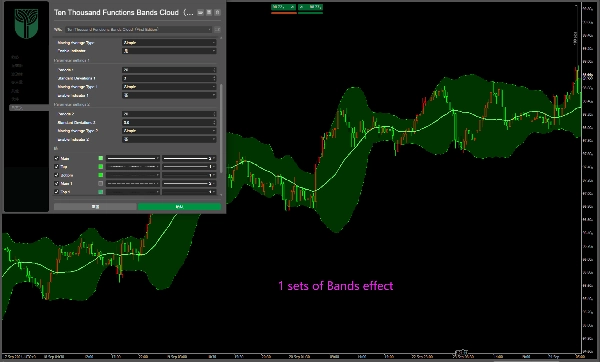
Bạn có thể đóng hoặc mở bất kỳ một hoặc hai nhóm; Và các tham số khác nhau có thể được sửa đổi và thiết lập!
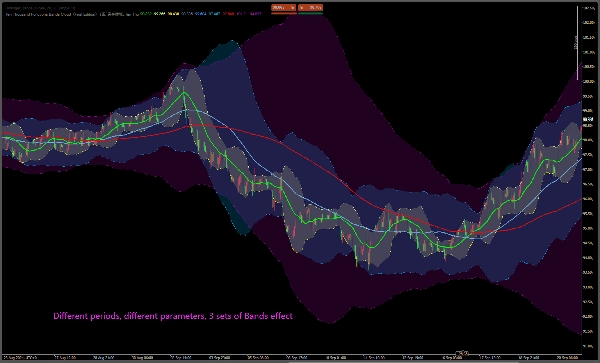
Nó cũng có thể được sửa đổi thành các giá trị khác, chẳng hạn như 2.0:20, 60, 144Bands;
Đường giữa của Bands bằng với đường trung bình động, đó là các đường trung bình động 20, 60 và 144!
Chúng ta có thể phán đoán và phân tích "Thung lũng Chết" và "Thung lũng Núi Vàng" dựa trên đường giữa của Bollinger Bands!
常规3组Bands:
周期:20
偏差:2.0;3.0; 3.5;
支持云背景!
您可以关闭或打开任意一个或两个组;并且可以修改和设置不同的参数!
它也可以修改为其他值,如2.0:20、60、144布林带;
Bands中轨等于移动平均线,即20、60和144移动平均线!
我们可以根据布林中轨迹来判断和分析“死亡谷”和“金山谷”等......
標準3グループボリンジャーバンド(Bands):期間:20;偏差値:2.0;3.0;3.5;クラウドバックグラウンドに対応!任意の1グループまたは2グループをオン/オフ設定することが可能です。また、各パラメーターの修正と設定も行えます。他の数値に変更することも可能です。例えば2.0の偏差値で、期間20、60、144のボリンジャーバンドに設定するなど。ボリンジャーバンドの中線は移動平均線に等しく、すなわち期間20、60、144の移動平均線です。ボリンジャーバンドの中線に基づいて、「デッドバレー(死亡谷)」や「ゴールドバレー(金山谷)」などを判断・分析することができます。
Стандартные 3 группы Бандов (Полос Боллинджера): Период: 20; Отклонение: 2,0; 3,0; 3,5; Поддержка облачного фона! Вы можете отключить или включить любую одну или две группы; кроме того, вы можете изменять и настраивать различные параметры! Его также можно изменить на другие значения, например, Боллинджеры с отклонением 2,0 и периодами 20, 60, 144; Средняя линия Бандов равна скользящей средней, то есть скользящим средним с периодами 20, 60 и 144! Мы можем определять и анализировать такие явления, как «Мёртвая долина» и «Золотая долина», на основе средней линии 。
Tóm tắt
Đánh giá của khách hàng
5 | 100 % | |
4 | 0 % | |
3 | 0 % | |
2 | 0 % | |
1 | 0 % |


