
VIX - volatility indicator
Chỉ báo
2 lượt mua
Phiên bản 1.2, Apr 2026
Windows, Mac
4.5
Đánh giá: 2
Mô tả
Chỉ báo VIX độc quyền này, được hỗ trợ bởi Average True Range (ATR), cung cấp phân tích chính xác và rõ ràng về biến động thị trường, tối ưu cho cTrader 5.5.13+. Nó kết hợp chuyển động VIX có tỷ lệ với phân tích khối lượng để xác nhận các biến động lớn và khả năng bứt phá tiềm năng.
Tính Năng Chính & Chất Lượng Mã
- Không Lỗi/Cảnh Báo: Được tái cấu trúc hoàn toàn theo API cTrader mới nhất, loại bỏ tất cả lỗi và cảnh báo cũ để đạt độ ổn định và hiệu suất tối đa.
- VIX Dựa Trên ATR: Cung cấp thước đo phản ứng về biến động, được chuẩn hóa để nhận diện các điều kiện thị trường cực đoan.
- Xác Nhận Kép: Sử dụng biến động (đường VIX) kết hợp với dữ liệu Khối Lượng Tick để xác thực các cảnh báo bứt phá có xác suất cao.
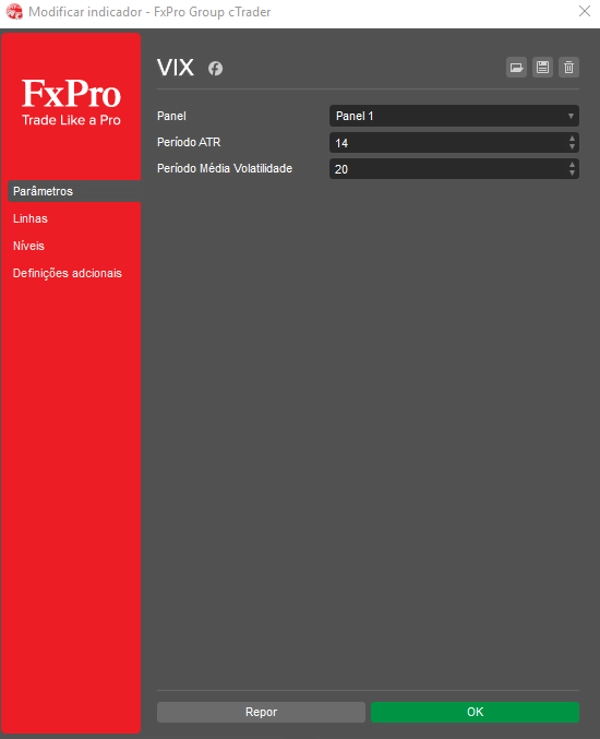
Tùy Chỉnh Cài Đặt Để Có Cái Nhìn Tối Ưu
Dễ dàng điều chỉnh chỉ báo để phù hợp với chiến lược giao dịch của bạn bằng cách đặt các giá trị mong muốn cho Mức VIX Thấp và Mức VIX Cao. Ngoài ra, điều chỉnh Hệ Số Tỷ Lệ VIX để kiểm soát chính xác chiều cao và cách hiển thị đường VIX trong bảng điều khiển dưới.
Cách Đọc Tín Hiệu Bứt Phá & Tích Lũy
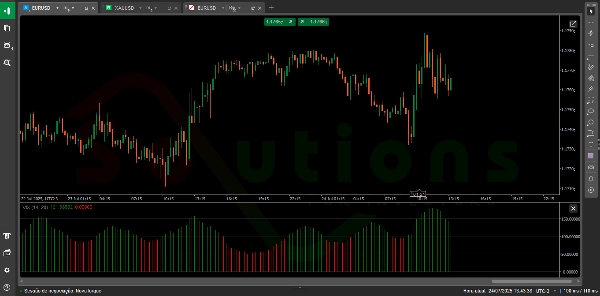
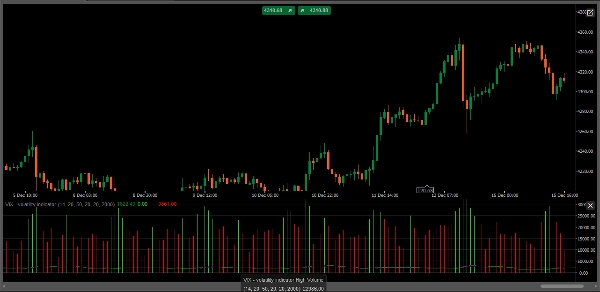
- Cảnh Báo Bứt Phá (Biến Động Cao): Khi đường VIX phá vỡ mạnh mẽ trên Mức VIX Cao VÀ đi kèm với khối lượng cao (được biểu thị bằng biểu đồ Khối Lượng Cao), điều này xác nhận sự sợ hãi/tham lam cực độ và báo hiệu một đợt bứt phá thị trường có xác suất cao.
- Tín Hiệu Tích Lũy (Biến Động Thấp): Khi đường VIX giảm xuống dưới Mức VIX Thấp, thường báo hiệu giai đoạn thị trường yên tĩnh, tích lũy chặt chẽ hoặc khả năng hồi quy về trung bình — lý tưởng để chuẩn bị cho bước đi tiếp theo hoặc giảm thiểu rủi ro.
- Thông Tin Khối Lượng: Chỉ báo vẽ biểu đồ Khối Lượng Cao (Màu Xanh Lá) và Khối Lượng Thấp (Màu Đỏ) ở nền, giúp bạn nhanh chóng đánh giá tính thanh khoản và sự tin tưởng đằng sau hành động giá hiện tại.
Tóm tắt
Tóm tắt AI
The VIX - Volatility Indicator is a proprietary tool designed for the cTrader platform (version 5.5.13 and above) that measures market volatility using an Average True Range (ATR)-based approach. It combines a scaled VIX line with tick volume data to provide dual confirmation of market conditions, helping traders identify potential breakouts and consolidation phases.
Key features include:
- ATR-based VIX calculation for responsive volatility measurement normalized to detect extreme market conditions.
- Volume analysis with high (green) and low (red) volume histograms to assess liquidity and conviction behind price movements.
- Customizable parameters allowing users to set Low VIX Level and High VIX Level thresholds, as well as adjust the VIX Scale Factor for optimal visualization.
Usage signals:
- A breakout alert occurs when the VIX line surpasses the High VIX Level accompanied by high volume, indicating potential market breakouts driven by extreme fear or greed.
- A consolidation signal is identified when the VIX falls below the Low VIX Level, suggesting periods of low volatility, market calm, or potential mean reversion.
This indicator supports analysis across various markets including Forex, indices, commodities, stocks, and cryptocurrencies.
Hồ sơ chỉ báo
Đánh giá của khách hàng
4.5
Đánh giá: 2
5 | 50 % | |
4 | 50 % | |
3 | 0 % | |
2 | 0 % | |
1 | 0 % |
Đánh giá của khách hàng
March 6, 2025
ngl, breaks are easier to judge and that is enough to keep testing it. It is not the whole trading plan.
February 28, 2025
reads better when the chart already supports the idea. Spread and slippage need a line in the notes.
Thảo luận
Câu hỏi thường gặp
BTCUSD
Forex
Signal
Breakout
Indices
EURUSD
Commodities
GBPUSD
NZDUSD
Prop
Crypto
Stocks
XAUUSD
NAS100
USDJPY
Các sản phẩm có sẵn trên cTrader Store, bao gồm bot giao dịch, chỉ báo và plugin, được cung cấp bởi các nhà phát triển bên thứ ba và chỉ nhằm mục đích cung cấp thông tin và tiếp cận kỹ thuật. cTrader Store không phải là nhà môi giới và không cung cấp lời khuyên đầu tư, khuyến nghị cá nhân hay bất kỳ đảm bảo nào về hiệu suất trong tương lai.


![Logo "High-Low Divergence [Iridio Capital]"](https://cdn.ctrader.com/image/webp/443c4661-7abb-40f1-842f-4b6ec560649b_40914)


Giá
Kể từ 05/02/2025
31
Lượt bán