
Zigzag T3
Chỉ báo
2 lượt mua
Phiên bản 1.0, Sep 2024
Windows, Mac
4.5
Đánh giá: 2
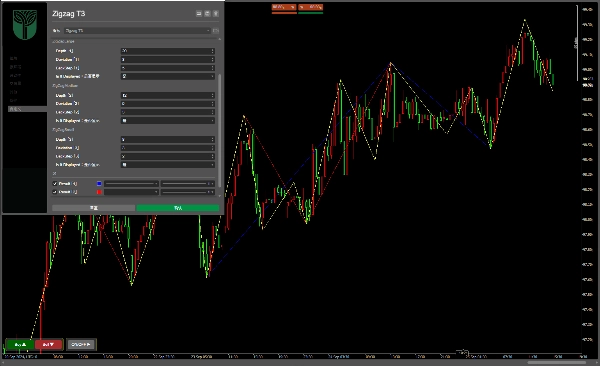
Mô tả
Ba đường ZigZag
Có thể đóng hoặc mở một hoặc nhiều đường
Tóm tắt
Hồ sơ chỉ báo
Đánh giá của khách hàng
4.5
Đánh giá: 2
5 | 50 % | |
4 | 50 % | |
3 | 0 % | |
2 | 0 % | |
1 | 0 % |
Thảo luận
Câu hỏi thường gặp
Các sản phẩm có sẵn trên cTrader Store, bao gồm bot giao dịch, chỉ báo và plugin, được cung cấp bởi các nhà phát triển bên thứ ba và chỉ nhằm mục đích cung cấp thông tin và tiếp cận kỹ thuật. cTrader Store không phải là nhà môi giới và không cung cấp lời khuyên đầu tư, khuyến nghị cá nhân hay bất kỳ đảm bảo nào về hiệu suất trong tương lai.
Sản phẩm khác của tác giả này


Giá
Kể từ 11/09/2024
4
Lượt bán
58
Cài đặt miễn phí