
Mô tả
🚀 Hệ Thống Phá Vỡ Kênh
Thuật toán chuyên biệt này được thiết kế để xác nhận điểm vào và ra một cách chính xác 🎯 bằng cách kết hợp nhiều yếu tố phân tích kỹ thuật để cung cấp các tín hiệu đáng tin cậy.
🔍 Nó hoạt động như thế nào?
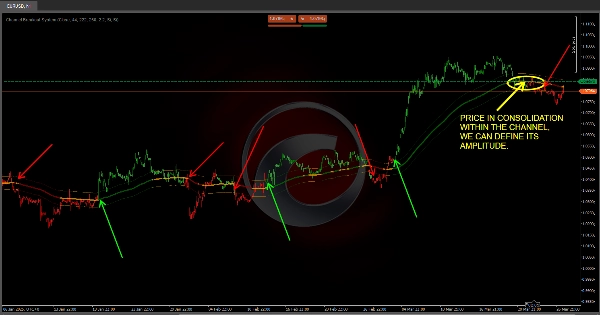
📊 Kênh Dựa trên Biến động (ATR)
✅ Biến động thị trường được tính toán bằng ATR (Average True Range) 📉.
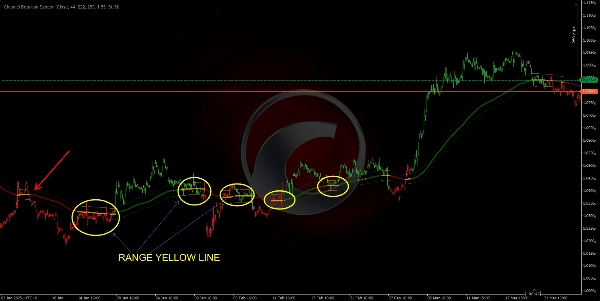
✅ "Trend MA" được điều chỉnh bằng cách cộng và trừ một giá trị tỷ lệ với biến động này, tạo thành hai đường chấm đóng vai trò như "trần" và "sàn" của thị trường.
✅ Điều này có ý nghĩa gì với bạn? Nếu giá duy trì trong kênh, thị trường có thể đang trong giai đoạn đi ngang hoặc tích lũy; nếu nó phá vỡ rõ ràng, đó là tín hiệu của một xu hướng mạnh mẽ 📈📉.
✅ Hoàn toàn tùy chỉnh! Điều chỉnh cài đặt kênh để phù hợp với chiến lược của bạn 📌.
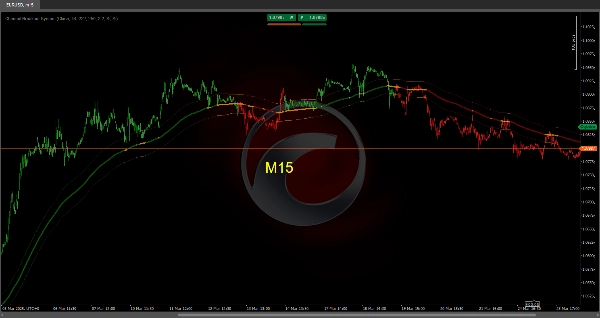
🟢 Phát hiện Xu hướng với Màu sắc Thông minh
🔹 Chỉ báo so sánh vị trí của MA nhanh với MA trung bình, và cả hai so với Trend MA.
🔹 Dựa trên giai đoạn thị trường, nến thay đổi màu sắc:
- 🟢 Xanh lá → Giai đoạn thị trường tăng giá.
- 🔴 Đỏ → Giai đoạn thị trường giảm giá.
- 🟠 Cam hoặc trung tính → Có thể là giai đoạn tích lũy hoặc không chắc chắn.
🔹 Nếu giá và các đường trung bình động "kẹt" bên trong kênh, đó là tín hiệu của giai đoạn tích lũy, giúp bạn tránh giao dịch trong các vùng không quyết đoán.
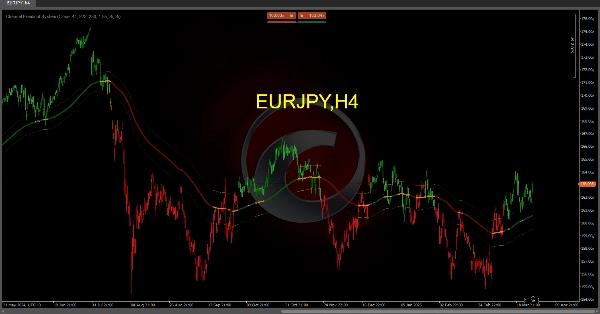
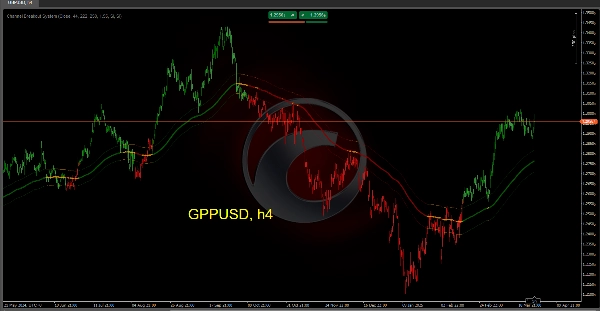
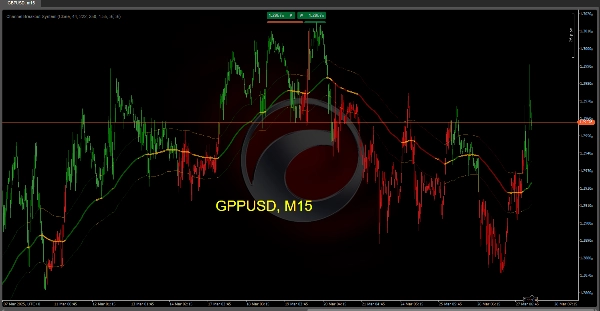
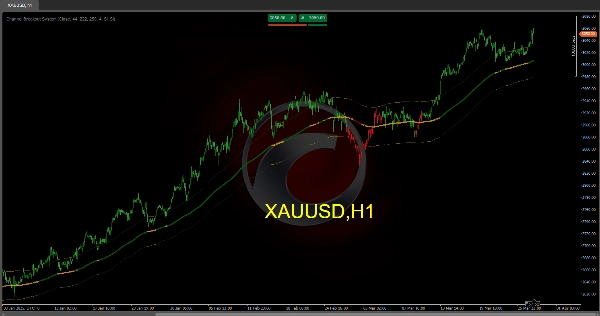
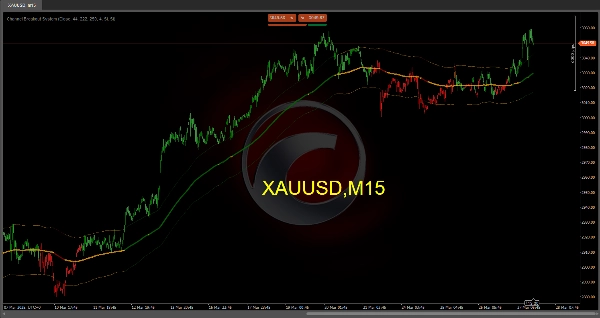
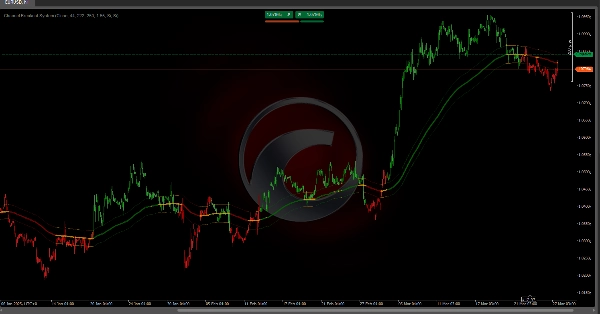
🎯 Trông như thế nào trên Biểu đồ
🔵 Đường xu hướng chính: Thay đổi màu sắc tùy theo hướng thị trường (xanh, đỏ hoặc cam).
📏 Kênh chấm: Phản ánh phạm vi thị trường dựa trên biến động.
📊 Thanh màu: Cung cấp biểu diễn trực quan dễ dàng về giai đoạn thị trường hiện tại.
🚀 Tại sao nên sử dụng Hệ thống này?
✔ Nhanh chóng nhận biết thị trường đang trong xu hướng hay đi ngang.
✔ Nổi bật trực quan sức mạnh và hướng của xu hướng.
✔ Dự đoán các điểm đảo chiều tiềm năng với tín hiệu phá vỡ và giao cắt rõ ràng.
✔ Xác nhận điểm vào và ra, giảm tín hiệu sai và cải thiện độ chính xác giao dịch.
🔹 Tối ưu hóa giao dịch và hoạt động với sự tự tin cao hơn bằng cách sử dụng Hệ Thống Phá Vỡ Kênh 🏆. Hãy sẵn sàng để phát hiện những cơ hội thị trường tốt nhất! 📈🔥
Các chỉ báo trên Ctrader Store:
Cấu Trúc Thị Trường Động
Phân Tích Các Điểm Quay
Fibonacci Linear
Hồi Quy Đa Khung Thời Gian
Định Hướng Nến Đa Cấp
Theo Dõi
Đường Trung Bình Động Phản Ứng
Đường Hỗ Trợ và
Kháng Cự Xu Hướng Tự Động
Tất Cả Các Mức Hỗ Trợ và
Kháng Cự
Tóm tắt
The system features smart color-coded trend detection by comparing fast, medium, and trend MAs, with candles changing color to indicate market phases: green for bullish, red for bearish, and orange for consolidation or uncertainty. This visual aid helps identify trend strength, direction, and potential consolidation zones.
On the chart, the main trend line changes color based on market direction, the dotted channel reflects volatility-based range, and colored bars provide an easy visual representation of the current market phase.
The indicator is fully customizable to fit different trading strategies. It aims to quickly identify trending or ranging markets, anticipate potential reversals with breakout and crossover signals, and confirm entry and exit points to reduce false signals and improve trade accuracy.
Đánh giá của khách hàng
5 | 33 % | |
4 | 67 % | |
3 | 0 % | |
2 | 0 % | |
1 | 0 % |


