
Gann_Pivot_Vision
지표
1 구매
버전 1.0, Dec 2025
Windows, Mac
4.0
리뷰: 1
설명
Gann Pivot Vision은 고전적인 피벗 반전 수준과 Gann 기하학을 결합한 혁신적인 분석 도구로, 트레이더가 주요 지지/저항 수준을 시각적으로 식별하고 높은 정확도로 시장 반전을 예측할 수 있게 합니다.
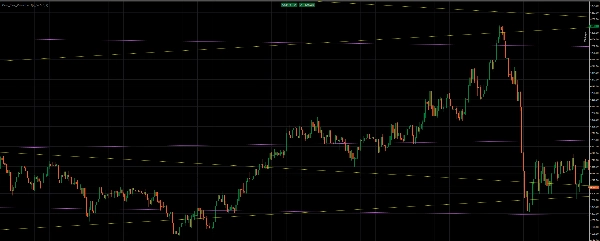
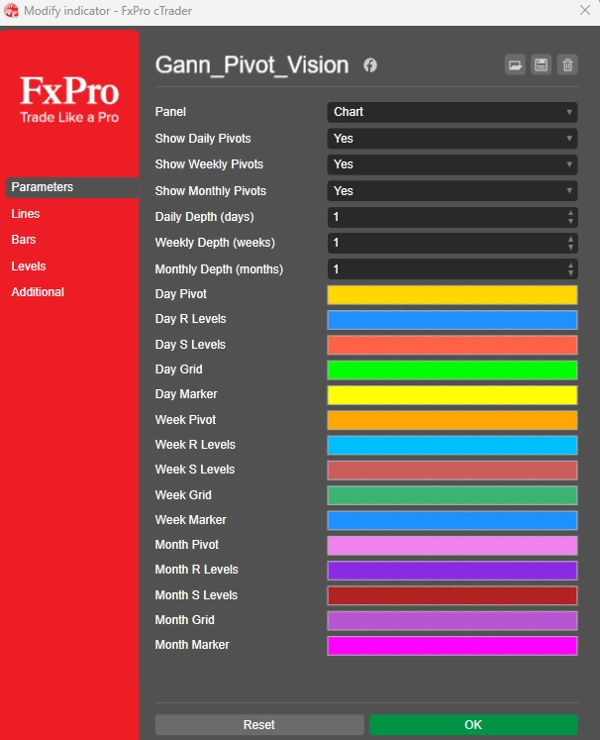
이 지표는 자동으로 다음을 구축합니다:
✔ 일간 피벗 레벨
✔ 주간 피벗 레벨
✔ 월간 피벗 레벨
각 시간대는 고유한 색상 체계로 표시되며 필요에 따라 활성화 또는 비활성화할 수 있습니다.
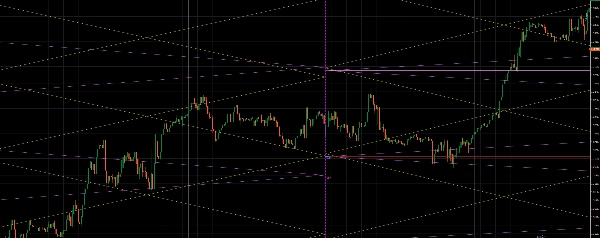
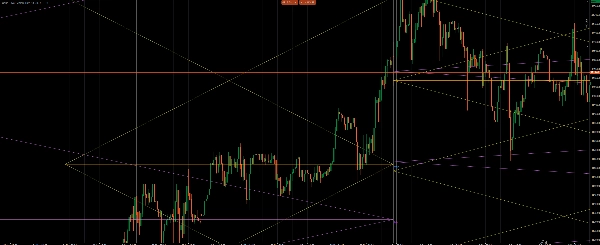
🔷 Gann 그리드 및 대각선 구조
추가로, 이 도구는 이전 기간의 범위를 기반으로 다이아몬드 형태의 Gann 그리드를 생성합니다.:
◾ 대각선 라인 (Gann 대칭)
◾ 기하학적 교차점 — 주요 시장 반응 영역
◾ 구조의 중심 = 기간의 중앙 가격 (피벗 포인트)
이 조합을 통해 다음을 할 수 있습니다:
🔹 강력한 가격 클러스터 식별
🔹 반전 가능성이 높은 영역 식별
🔹 추세 및 역추세 신호 확인
요약
지표 프로필
고객 리뷰
4.0
리뷰: 1
5 | 0 % | |
4 | 100 % | |
3 | 0 % | |
2 | 0 % | |
1 | 0 % |
고객 리뷰
December 17, 2025
The opening read should not drive the only input, but the setup still needs say no.
상담
자주 묻는 질문(FAQ)
Forex
Signal
Breakout
Scalping
Indices
Stocks
트레이딩 봇, 지표, 플러그인 등 cTrader Store에서 제공되는 상품은 제3자 개발자에 의해 제공되며, 이는 단순히 정보 및 기술적 접근을 목적으로 제공된 것입니다. cTrader Store는 중개인이 아니며, 투자 조언, 개인별 추천 또는 향후 성과에 대한 어떠한 보장도 제공하지 않습니다.
이 작성자의 상품 더 보기


!["Gaussian Channel [Iridio Capital]" 로고](https://cdn.ctrader.com/image/webp/7c039209-5573-4a54-a072-f9528b503103_41960)


가격
가입일 24/10/2025
1.43M
거래량
4.79K
핍 수익
2
판매
319
무료 설치