
MACDVolume
อินดิเคเตอร์
19 การซื้อ
เวอร์ชัน 1.0, Dec 2024
Windows, Mac
5.0
รีวิว: 3

คำอธิบาย
ตัวชี้วัด MACD ขั้นสูงพร้อมการเปลี่ยนสีแบบไดนามิกและปริมาณ
คำอธิบาย: ตัวชี้วัด MACD ขั้นสูงของเราไม่ใช่แค่ฮิสโตแกรมธรรมดา ตัวชี้วัดนี้ถูกออกแบบมาเพื่อให้มุมมองที่ชัดเจนและไดนามิกของแนวโน้มตลาด พร้อมคุณสมบัติพิเศษที่ทำให้เป็นสิ่งจำเป็นสำหรับเทรดเดอร์ที่จริงจังทุกคน
คุณสมบัติหลัก:
- การเปลี่ยนสีแบบไดนามิก:
-
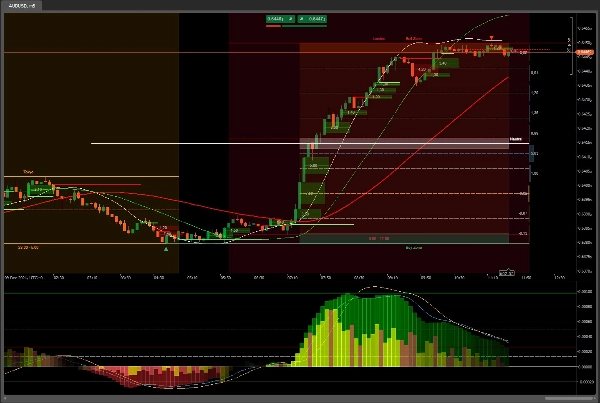
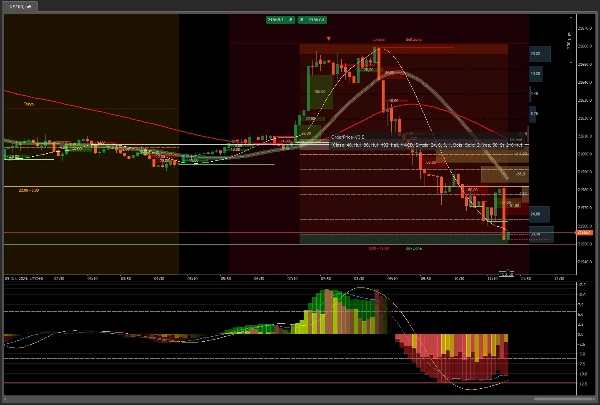
- บวก: ฮิสโตแกรมเปลี่ยนจากสีเขียวเป็นสีขาวเมื่อค่ามากขึ้น ให้ภาพที่ชัดเจนของแนวโน้มขาขึ้น
- ลบ: ฮิสโตแกรมเปลี่ยนจากสีแดงเป็นสีขาวเมื่อค่าน้อยลง เน้นแนวโน้มขาลง
- ตัวชี้วัดปริมาณ:
-
- ปริมาณบวก: แสดงด้วยแท่งสีเขียว บ่งชี้การเพิ่มขึ้นของปริมาณการซื้อขาย
- ปริมาณลบ: แสดงด้วยแท่งสีแดง บ่งชี้การลดลงของปริมาณการซื้อขาย
- การแสดงผลที่ชัดเจน: การผสมผสานของสีในแท่งปริมาณ (เขียว เหลือง น้ำตาล แดง) ให้มุมมองที่ชัดเจนของกิจกรรมการซื้อและขายในตลาด
- ซูมอัตโนมัติ:
-
- รักษาตัวชี้วัดให้อยู่ตรงกลางและปรับอัตโนมัติสำหรับการดูที่เหมาะสม โดยไม่ต้องปรับด้วยมือบ่อยๆ
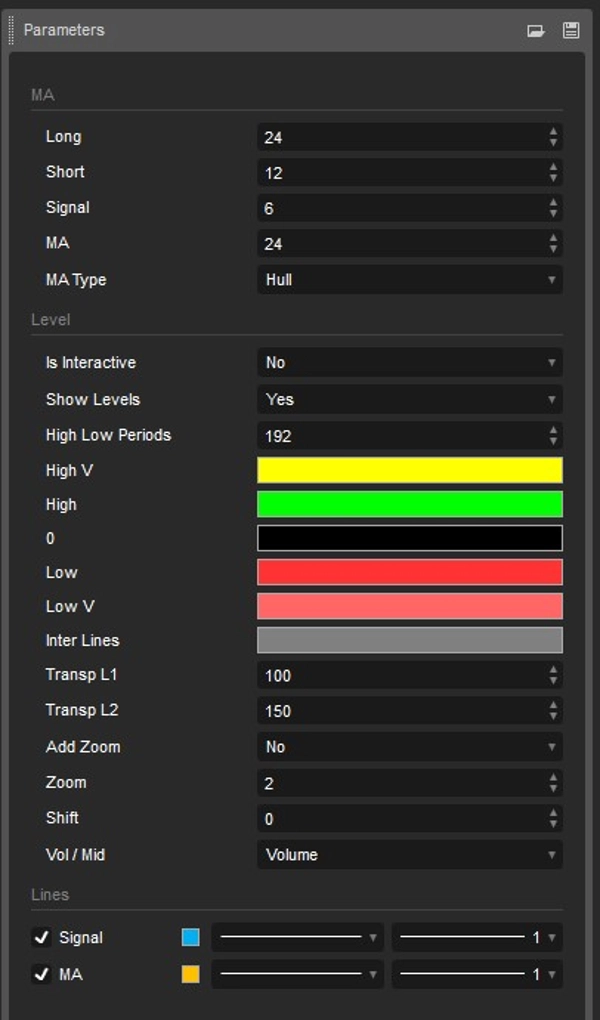
- ค่าเฉลี่ยเคลื่อนที่ที่ปรับแต่งได้:
-
- รวมค่าเฉลี่ยเคลื่อนที่เพิ่มเติมที่คุณสามารถเลือกจากตัวเลือกที่มีอยู่ เพื่อให้สามารถปรับแต่งและปรับใช้กับกลยุทธ์การเทรดของคุณได้มากขึ้น
- จุดสูงสุดและต่ำสุด:
-
- แสดงระดับสูงสุดและต่ำสุดในช่วงเวลาที่เลือก ให้มุมมองที่ชัดเจนของจุดสุดขีดของตลาด
ประโยชน์:
- ความชัดเจนทางสายตา: การเปลี่ยนสีแบบไดนามิกช่วยให้ระบุแนวโน้มและจุดเปลี่ยนในตลาดได้ง่าย
- การปรับแต่ง: ความสามารถในการเลือกค่าเฉลี่ยเคลื่อนที่ต่างๆ และปรับระดับสีช่วยให้คุณปรับตัวชี้วัดให้เหมาะกับความต้องการเฉพาะของคุณ
- ประสิทธิภาพ: ซูมอัตโนมัติช่วยให้คุณมีมุมมองที่ดีที่สุดของตัวชี้วัดเสมอโดยไม่ต้องปรับด้วยมือ
- การวิเคราะห์ที่ครอบคลุม: รวมถึงปริมาณและระดับสูง/ต่ำให้มุมมองที่สมบูรณ์ยิ่งขึ้นของตลาด
เหมาะสำหรับ:
- เทรดเดอร์ที่มองหาเครื่องมือขั้นสูงและปรับแต่งได้เพื่อเพิ่มประสิทธิภาพการวิเคราะห์ทางเทคนิคของตน
- ผู้ที่ต้องการการแสดงผลที่ชัดเจนและไดนามิกของแนวโน้มตลาด
- ผู้ใช้ที่ให้ความสำคัญกับประสิทธิภาพและการปรับแต่งในเครื่องมือการเทรดของตน
พร้อมด้วยเครื่องมือเพิ่มเติมเช่น
OrderPrice V3 https://ctrader.com/products/397
NTMPICLL https://ctrader.com/products/327
Range Box Level https://ctrader.com/products/245
Or RangeBoxFibonacci https://ctrader.com/products/526
Market Session https://ctrader.com/products/525
MacdVolume https://ctrader.com/products/267
4MA https://ctrader.com/products/247
คุณจะเป็นอมตะ
โชคดี 😀
สรุป
สรุปโดย AI
The MACDVolume indicator is an advanced technical analysis tool combining the Moving Average Convergence Divergence (MACD) histogram with volume data for enhanced market trend visualization. It features dynamic color changes in the MACD histogram: bullish trends are shown by a gradient from green to white, while bearish trends shift from red to white. The volume component uses color-coded bars—green for increasing volume and red for decreasing volume—with additional colors (yellow, brown) to clearly depict buying and selling activity.
Key functionalities include auto zoom, which keeps the indicator centered and optimally scaled without manual adjustment, and a customizable moving average that can be selected from available options to fit different trading strategies. The indicator also displays the highest and lowest price levels within the selected period, providing insight into market extremes.
Designed for traders seeking a customizable and efficient tool, MACDVolume offers clear visual cues for trend identification and comprehensive market analysis by integrating volume and price extremes. It supports markets such as Forex and Stocks and is suitable for users who prioritize clarity, customization, and efficiency in their technical indicators.
โปรไฟล์อินดิเคเตอร์
รีวิวจากลูกค้า
5.0
รีวิว: 3
5 | 100 % | |
4 | 0 % | |
3 | 0 % | |
2 | 0 % | |
1 | 0 % |
รีวิวจากลูกค้า
January 12, 2026
August 28, 2025
MACDVolume is a strong complementary tool for traders already using MACD. It enhances decision-making by incorporating volume, making signals more trustworthy.
April 17, 2025
การสนทนา
คำถามที่พบบ่อย
Forex
Stocks
MACD
ผลิตภัณฑ์ที่มีให้บริการผ่าน cTrader Store รวมถึงบอทการเทรด อินดิเคเตอร์ และปลั๊กอิน มีให้บริการโดยนักพัฒนาบุคคลที่สามและมีไว้เพื่อวัตถุประสงค์ในการเข้าถึงข้อมูลและทางเทคนิคเท่านั้น cTrader Store ไม่ใช่โบรกเกอร์และไม่ได้ให้คำแนะนำการลงทุน คำแนะนำส่วนบุคคล หรือการรับประกันผลการดำเนินงานในอนาคต


ราคา
147
การขาย
11.17K
ติดตั้งฟรี