
الوصف
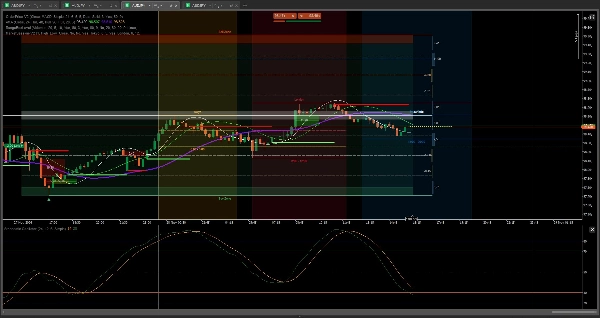
يوفر مؤشر التحليل الفني هذا معلومات حول معنويات السوق، الاتجاه ومستويات الأسعار. يستخدم بيانات مثل الحجم، الفتح_الإغلاق، تقلب تشايكين وتدفق أموال تشايكين لحساب معنويات السوق. كما يتيح لك تعديل الفروق، اكتشاف الاتجاهات وتصوير مستويات الأسعار والنقاط. إنه أداة مفيدة لتحديد القوة السائدة في السوق، توقع تحركات الأسعار وتحسين اتخاذ قرارات التداول.
في الوصف، أشير إلى المعلمات المهمة؛ الباقي هي إعدادات النمط مثل اللون، نوع الخط وحجم الخط.
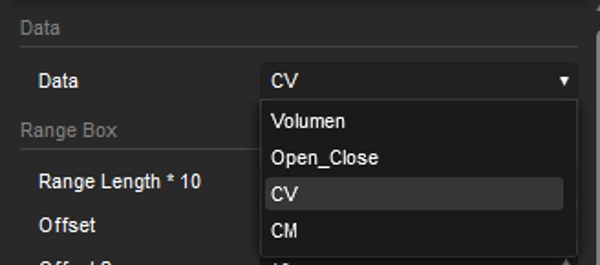
البيانات
تستند حسابات المعنويات إلى الاختيار من بين الحجم، الفتح_الإغلاق، تقلب تشايكين وتدفق أموال تشايكين.
طول النطاق * 10
تشير القيمة إلى عدد الشموع (الفترات) التي يستند إليها الحساب – يتم ضرب القيمة في 10.
إضافة تكبير
للحفاظ على تمركز الرسم البياني، يساعد هذا أيضًا في مراعاة حالات مثل التوحيد وتغيرات الاتجاه.
الهامش
يسمح بضبط الهوامش العلوية والسفلية لتحسين التصور.
عرض المعنويات
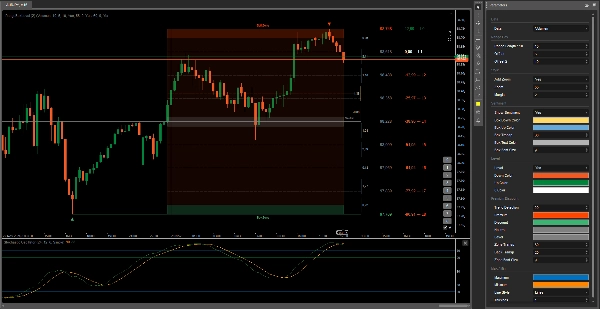
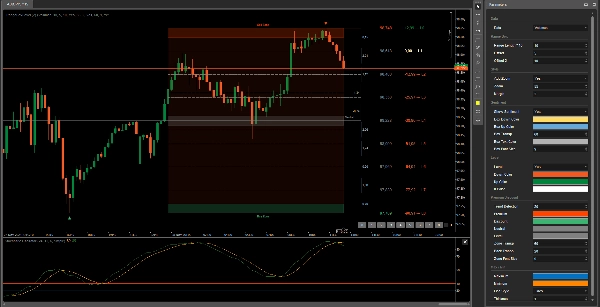
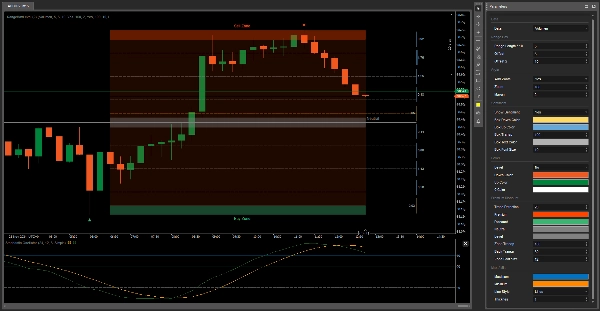
تشير المعنويات إلى القوة الأقوى في السوق في الوقت الحالي. إذا زادت أشرطة اللون الأصفر في الحجم، فهذا يعني وجود المزيد من البائعين، والعكس صحيح. إذا لم ترغب في رؤية تصور المعنويات، يمكنك إخفاؤه على الجانب الأيمن.
المستوى
هذه ميزة إضافية يمكن استخدامها كمرجع للأسعار والنقاط عند كل مستوى. عند اختيار مستوى ترغب في وضع أمر شراء فيه، يشير إلى النقاط عند كل مستوى التي يمكن أن يصل إليها السعر.
كشف الاتجاه
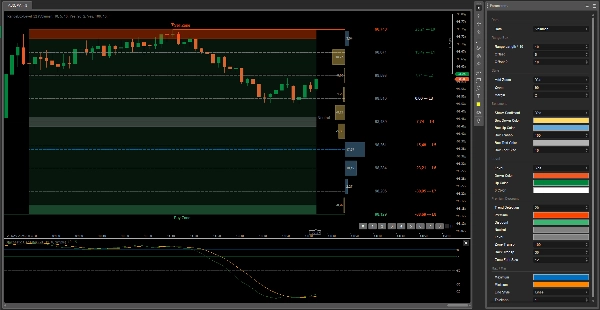
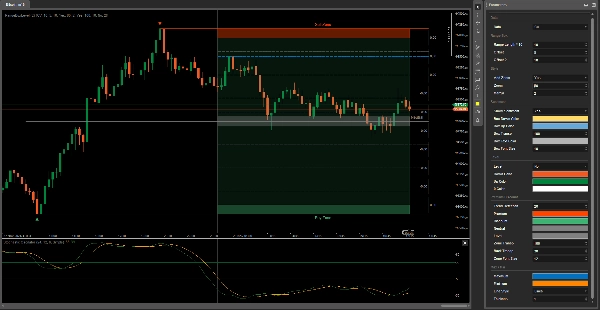
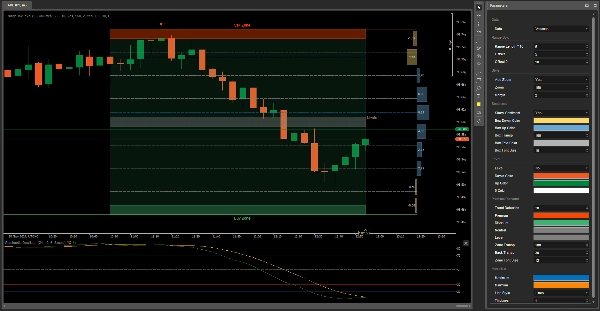
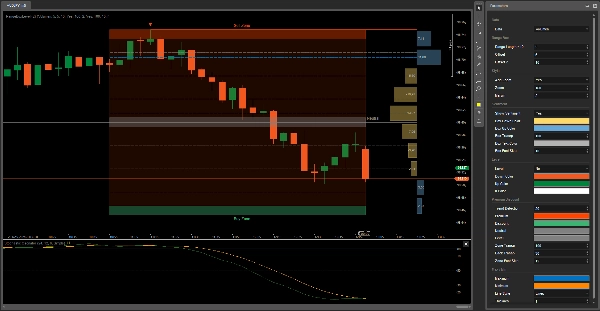
اعتمادًا على اتجاه الأصل، يتغير خلفية صندوق النطاق: أخضر إذا كان صاعدًا وأحمر إذا كان هابطًا.
الحد الأقصى / الحد الأدنى
هذه هي الخطوط الزرقاء والصفراء التي تغير موقعها وفقًا لتوقع مكان تحرك السعر. يتم تقسيم صندوق النطاق إلى 9 أقسام للمساعدة في تحديد نقاط انعطاف السعر، وتعمل كتصحيح فيبوناتشي.
ستكون لا تقهر
حظًا سعيدًا 😀
الملخص
Key features include sentiment visualization with bars indicating the dominance of buyers or sellers, trend detection through background color changes (green for bullish, red for bearish), and level indicators that display potential price and pip targets for placing orders. The Range Box is divided into nine sections to identify price inflection points, functioning similarly to Fibonacci retracement levels, with dynamic max/min lines predicting possible price movements.
This tool supports analysis across various markets including stocks, cryptocurrencies, indices like NAS100, and commodities such as XAUUSD (gold). It is suitable for trading strategies like scalping and grid trading and can assist traders in anticipating price movements and making informed decisions. The indicator integrates with additional tools for enhanced order price management and market session analysis.
تقييمات العملاء
5 | 100 % | |
4 | 0 % | |
3 | 0 % | |
2 | 0 % | |
1 | 0 % |


