
Descrizione
Profilo Cluster Domanda & Offerta SMAS parte SMAS
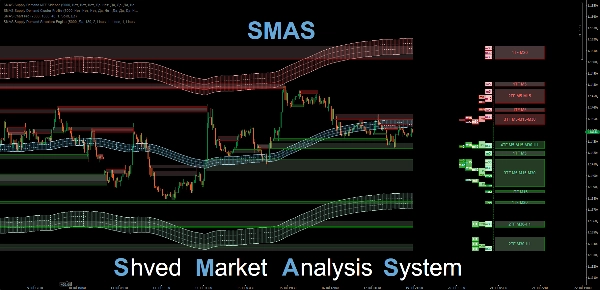
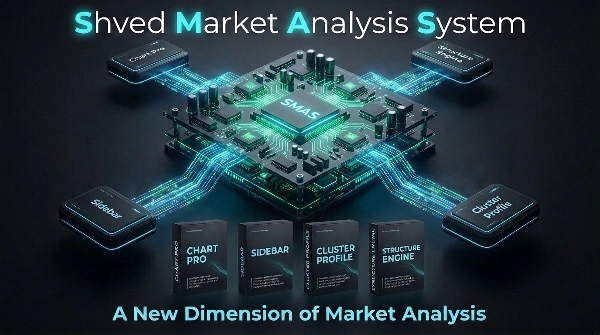
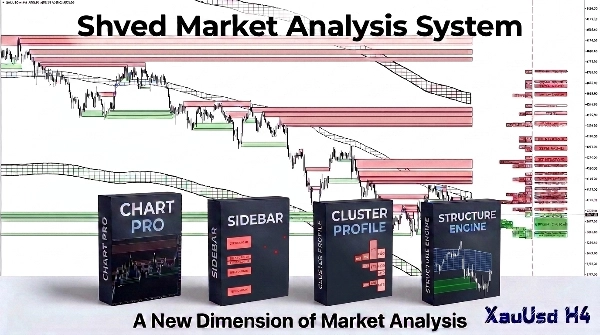
Profilo Cluster Domanda & Offerta SMAS è uno strumento professionale di analisi di mercato sviluppato dal creatore del noto indicatore Shved Supply and Demand, che ha ottenuto riconoscimento tra migliaia di trader in tutto il mondo. Questo indicatore funge da componente integrale e di collegamento dell'ecosistema unificato SMAS (Shved Market Analysis System) .
L'obiettivo principale dell'indicatore è organizzare la struttura di mercato multi-timeframe ed eliminare il disordine dal grafico consolidando livelli di prezzo frammentati in una mappa logica unica.
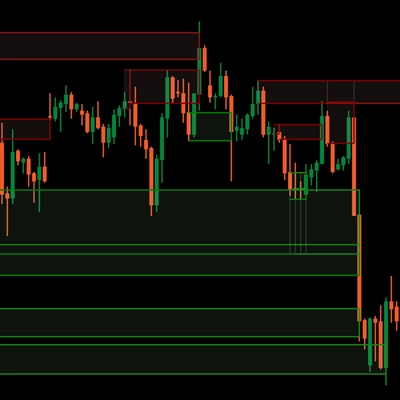
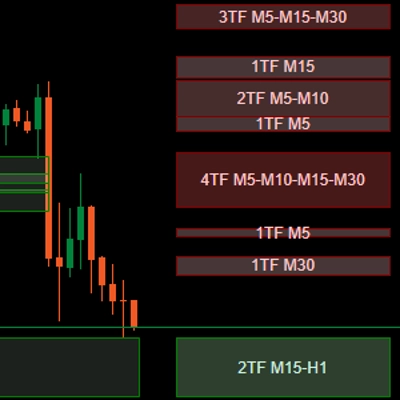
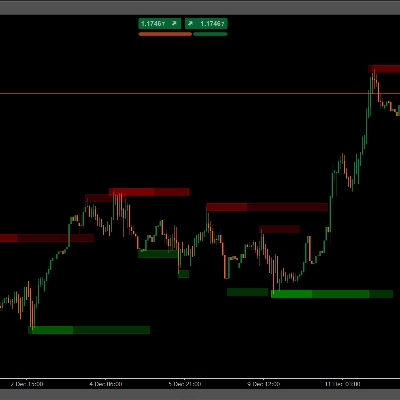
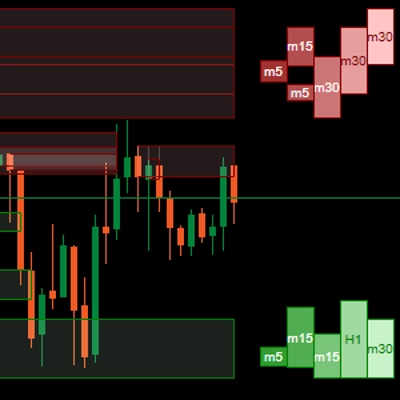
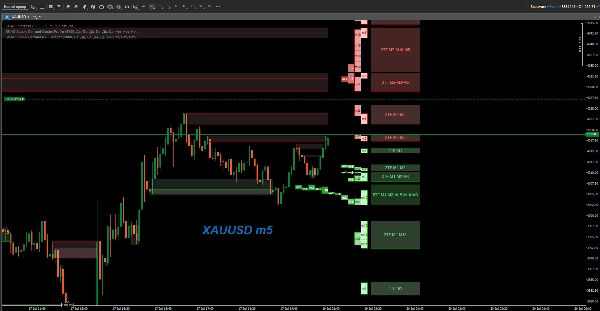
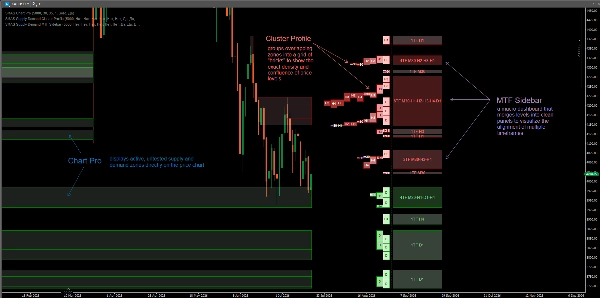
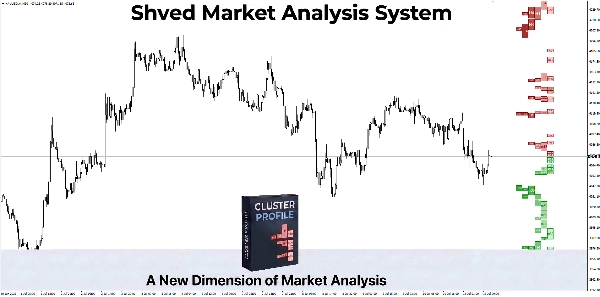
Gli indicatori convenzionali di domanda e offerta spesso sovraccaricano i grafici con rettangoli sovrapposti. SMAS Cluster Profile risolve questo problema utilizzando un algoritmo di clustering automatico. Scansiona i timeframe selezionati (da M1 a MN1) e aggrega le zone sovrapposte in blocchi consolidati (cluster) sul lato destro dello schermo, visualizzando chiaramente le aree di confluenza istituzionale.
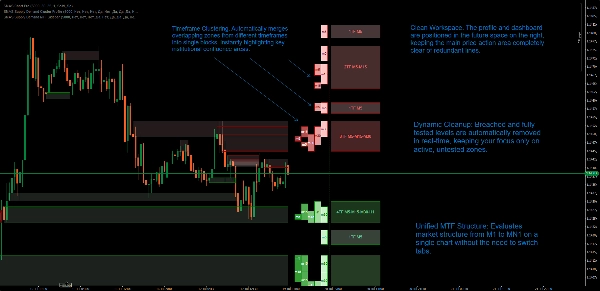
- Confluenza dei Timeframe: Combina zone da più timeframe in blocchi unificati. L'altezza e la densità del colore di ogni blocco indicano il numero di livelli sovrapposti, facilitando la valutazione della forza.
- Design Ergonomico e Pulito del Grafico: L'intero istogramma del profilo e la barra laterale di supporto sono proiettati nello spazio futuro (a destra del prezzo attuale), mantenendo l'area principale delle candele completamente libera per un'analisi confortevole.
- Integrazione Perfetta con SMAS: Progettato per funzionare in perfetta armonia con altri componenti dell'ecosistema (come SMAS Chart Pro e SMAS MTF Sidebar), creando una configurazione completa per il trading professionale.
- Filtro di Rilevanza Dinamico: L'algoritmo monitora l'azione del prezzo in tempo reale e rimuove immediatamente i livelli violati, mantenendo il grafico focalizzato esclusivamente sulle zone di liquidità non testate.
- Progettato per le Prestazioni: Scritto in C# specificamente per l'API cTrader con calcoli asincroni basati su timer e caching veloce dei dati, garantendo alte prestazioni del terminale.
SMAS Cluster Profile rappresenta anni di esperienza di trading e feedback della comunità dall'originale indicatore Shved Supply and Demand, offerto come sistema analitico di nuova generazione.
SMAS Supply & Demand Cluster Profile часть системы SMAS
SMAS Supply & Demand Cluster Profile — это профессиональный инструмент анализа рынка, разработанный автором широко известного индикатора Shved Supply and Demand, завоевавшего признание среди тысяч трейдеров по всему миру. Данный индикатор является неотъемлемой и связующей частью единой торговой экосистемы SMAS (Shved Market Analysis System).
Основная задача индикатора — систематизировать многотаймфреймовую структуру рынка и избавить график от хаотичного нагромождения уровней, объединяя разрозненную информацию в единую логическую карту.
Классические индикаторы зон спроса и предложения часто перегружают график пересекающимися прямоугольниками. SMAS Cluster Profile решает эту проблему, используя алгоритм автоматической кластеризации. Он сканирует выбранные интервалы (от M1 до MN1) и группирует перекрывающиеся зоны в единые блоки (кластеры) в правой части экрана, наглядно показывая места пересечения интересов крупных игроков (Confluence).
- Слияние таймфреймов (Confluence): Объединяет зоны разных ТФ в общие блоки. Высота и плотность цвета блока указывают на количество совпавших уровней, помогая быстро оценивать силу диапазона.
- Эргономика и чистый график: Вся гистограмма профиля и вспомогательный сайдбар вынесены в будущую область графика (справа от цены), оставляя зону свечей полностью свободной для комфортного технического анализа.
- Интеграция в экосистему SMAS: Индикатор спроектирован для бесшовной совместной работы с другими модулями системы (такими как SMAS Chart Pro и SMAS MTF Sidebar), формируя комплексное решение для профессионального трейдинга.
- Динамический фильтр актуальности: Алгоритм в реальном времени отслеживает пробитие уровней ценой и мгновенно удаляет отработанные зоны спроса и предложения, оставляя только актуальные ориентиры.
- Глубокая оптимизация: Код написан на C# специально под API cTrader с использованием асинхронного таймера и быстрого кэширования данных, что гарантирует стабильно высокую производительность терминала.
SMAS Cluster Profile — это результат многолетней практики и анализа отзывов сообщества пользователей оригинального индикатора Shved Supply and Demand, воплощенный в виде аналитической системы нового поколения.
Riepilogo
The indicator employs an automated clustering algorithm to reduce chart clutter caused by conventional supply and demand indicators that display numerous overlapping rectangles. It dynamically filters out breached levels in real-time, maintaining focus on active liquidity zones. The profile histogram and sidebar are positioned in the future price area, keeping the main candlestick chart clear for technical analysis.
Developed in C# for the cTrader platform, the indicator features asynchronous calculations and efficient data caching to ensure high performance. It integrates seamlessly with other components of the Shved Market Analysis System (SMAS) ecosystem, such as SMAS Chart Pro and SMAS MTF Sidebar, providing a comprehensive toolset for professional trading. The product supports visualization and signals for level touches and breaks based on bar data.