
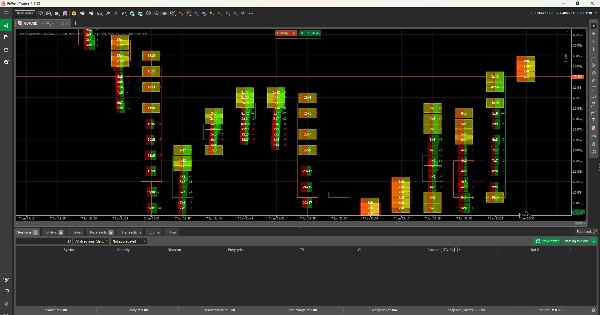
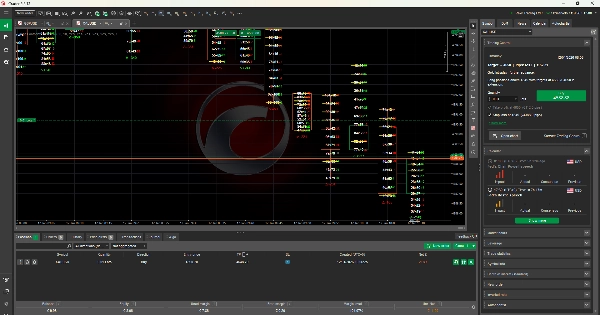
Delta Footprint Bid x Ask
Indicador
2 compras
Versão 2.0, Feb 2026
Windows, Mac
4.5
Avaliações: 2
Descrição
O que está incluído:
- Visão Geral - O que o indicador faz
- Conceito de Footprint - O que é trading footprint
- Método Detalhado de Cálculo - Como os volumes são calculados:
-
- Criação do nível de preço
- Algoritmo de distribuição de volume
- Lógica de divisão compra/venda
- Exemplos de cálculos
- Explicação da Exibição de Volume - O que significa "45x120"
- Interpretação do Delta - Positivo, negativo e cumulativo
- Principais Características - Desequilíbrios, POC, barras de volume
- Teoria do Fluxo de Ordens - Explicação de Bid vs Ask
- Limitações Importantes - Explicação honesta de que é estimado, não dados reais de ticks
- Aplicações de Trading - 5 cenários reais de trading
- Guia de Configurações - Explicação completa de todos os parâmetros
- Recomendações de Timeframe - Melhores configurações para diferentes estilos
- Dicas e Melhores Práticas
Pontos-chave sobre o cálculo:
O documento explica claramente que:
Os volumes são ESTIMADOS - porque o cTrader não fornece dados reais de ticks O algoritmo é inteligente - usa múltiplos fatores (tipo de candle, posição do preço, proximidade do fechamento) Os padrões são precisos - relações relativas refletem o fluxo real de ordens Honesto sobre as limitações - explica quando você precisa de dados reais da bolsa Mostra fórmulas exatas - transparência completa nos cálculos
Isso dá aos usuários expectativas realistas enquanto destaca o valor do indicador! 📊
Resumo
Resumo de IA
Delta Footprint Bid x Ask is a footprint volume indicator designed to display bid and ask volume splits at each price level. It estimates volume distribution using an intelligent algorithm that incorporates factors such as candle type, price position, and close proximity, as real tick data is not available on the cTrader platform. The indicator provides detailed volume calculations, including price level creation, buy/sell split logic, and example computations, offering transparency through exact formulas. Key features include identification of volume imbalances, point of control (POC), and volume bars, supporting analysis of order flow by comparing bid versus ask volumes. The indicator explains delta values—positive, negative, and cumulative—and offers guidance on settings and timeframe recommendations for various trading styles. It is applicable across multiple markets and symbols, including Forex pairs (EURUSD, GBPUSD, USDJPY, NZDUSD), indices (NAS100, SP500, DAX), commodities (gold, oil, silver), cryptocurrencies (BTCUSD), and stocks. The tool includes practical trading applications and best practices, helping users interpret footprint patterns that realistically mirror order flow despite volume estimates.
Perfil do indicador
Avaliações de clientes
4.5
Avaliações: 2
5 | 50 % | |
4 | 50 % | |
3 | 0 % | |
2 | 0 % | |
1 | 0 % |
Avaliações de clientes
January 20, 2026
For volume based context, this feels more useful as a filter than a full system. The journal should cover 55 setups and the trade context.
January 12, 2026
For me the fair test is value area with POC and VWAP. If the result still looks clean, the product becomes easier to trust.
Conversa
Perguntas frequentes
BTCUSD
Forex
Signal
Indices
EURUSD
Commodities
GBPUSD
NZDUSD
Prop
Scalping
Supertrend
Fair Value Gap
Crypto
Stocks
XAUUSD
NAS100
USDJPY
Os produtos disponíveis através da cTrader Store, incluindo bots de negociação, indicadores e plugins, são fornecidos por programadores terceiros e são disponibilizados apenas para fins informativos e de acesso técnico. A cTrader Store não é um corretor e não fornece aconselhamento em matéria de investimento, recomendações pessoais ou qualquer garantia de desempenho no futuro.
Mais deste autor


Preço
Desde 15/01/2025
7
Vendas