
Descrição
Revolucione seu Trading com o Indicador Definitivo de Padrões de Gráfico do cTrader
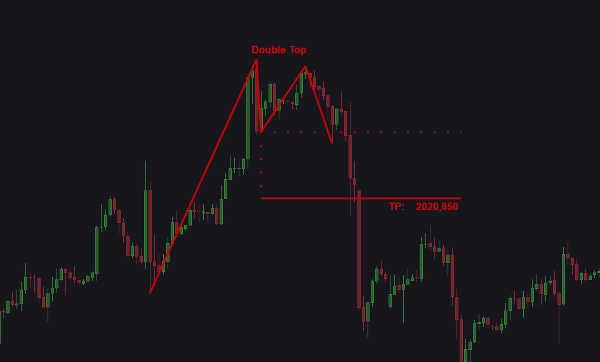
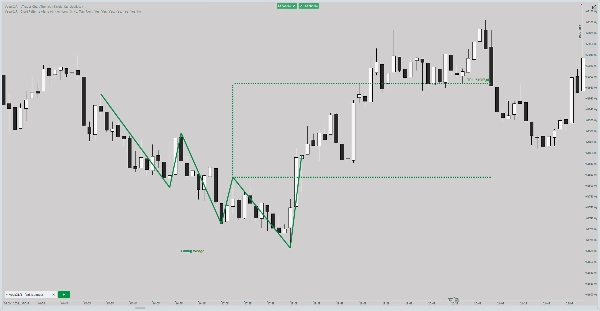
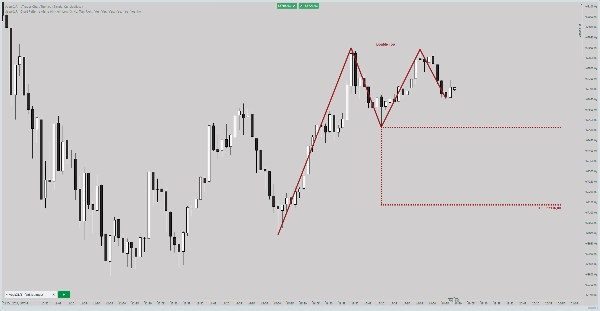
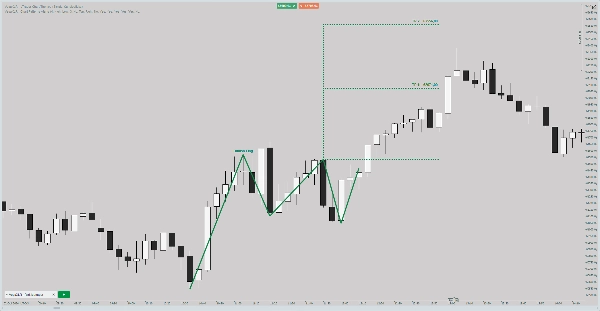
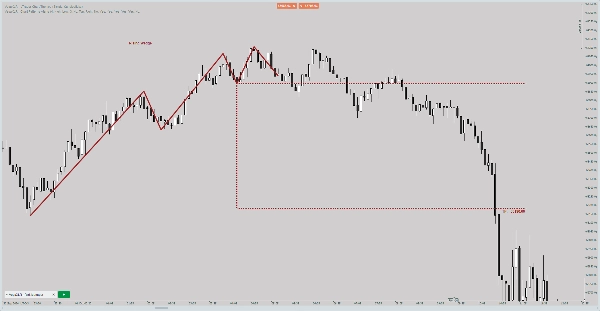
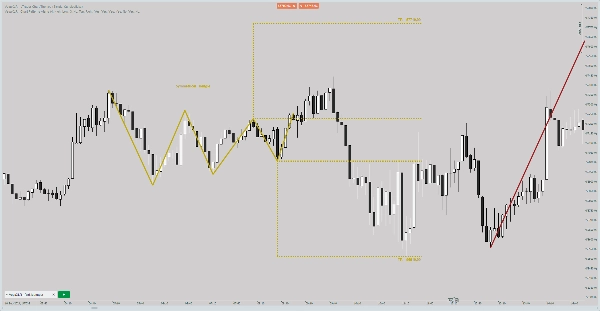
Leve sua estratégia de trading para o próximo nível com este indicador avançado do cTrader, projetado para detectar e destacar padrões críticos de gráfico para uma análise precisa do mercado. Esta ferramenta avançada identifica padrões-chave como Double Tops, Head and Shoulders, Ascending Triangles, e mais, oferecendo aos traders uma vantagem poderosa em forex, negociação no mercado de ações e todos os mercados presentes na plataforma cTrader.
Principais Características:
- Detecção Automática de Padrões de Gráfico: Identifique instantaneamente padrões como Bullish Flags, Symmetrical Triangles, e Rising Wedges.
- Plotagem de Oscilações de Padrão: Visualize linhas de pescoço, linhas-alvo, e movimentos de preço com facilidade.
- Alertas Personalizáveis: Mantenha-se informado com alertas via Som, Pop-up, Telegram, ou Email—adaptados às suas necessidades.
- Insights Codificados por Cores: Diferencie rapidamente entre padrões de alta, padrões de baixa, e padrões neutros usando esquemas de cores personalizáveis.
- Lista de Padrões com Estatísticas: Acompanhe facilmente as ocorrências de padrões com uma lista integrada mostrando abreviações e contagens.
- Níveis de Zoom Ajustáveis: Foque em tamanhos específicos de padrões para uma análise detalhada.
- Exibição do Potencial de Lucro: Avalie oportunidades potenciais de trade com indicações claras do tamanho do lucro.
- Clareza de Timeframe e Símbolo: Alertas incluem detalhes precisos sobre o símbolo e timeframe para uma tomada de decisão informada.
- Opção de Pausar Alertas: Analise padrões sem distrações pausando as notificações.
- Recurso de Notas do Usuário: Adicione comentários para refinamento de estratégias ou notas específicas de padrões.
Padrões de Gráfico Detectados:
- Double Top
- Double Bottom
- Head and Shoulders
- Inverse Head and Shoulders
- Symmetrical Triangle
- Ascending Triangle
- Descending Triangle
- Bullish Flag
- Bearish Flag
- Rising Wedge
- Falling Wedge
Este indicador de trading intuitivo capacita os traders ao combinar detecção automatizada de padrões de gráfico, alertas personalizáveis, e visualizações em tempo real. Quer você esteja negociando no mercado forex, analisando gráficos de ações, ou explorando indicadores personalizados do cTrader, esta ferramenta fornece os insights necessários para tomar decisões mais inteligentes e confiantes. Perfeito para traders que buscam dominar a análise técnica e otimizar suas estratégias de gestão de risco.
Desbloqueie seu potencial de trading hoje com este indicador completo do cTrader!
Aviso:
Este indicador é uma ferramenta de análise técnica projetada para auxiliar traders fornecendo insights e visualizações baseadas em padrões de gráfico e dados de mercado. Ele não funciona como uma solução de trading independente e não garante resultados lucrativos. Os usuários devem implementar suas próprias estratégias de trading, gestão de risco e processos de tomada de decisão ao usar este produto. Desempenho passado não é indicativo de resultados futuros. Negociar em mercados financeiros envolve riscos significativos, e você deve negociar apenas com capital que pode perder.
Resumo
Key functionalities include automatic pattern detection, real-time visualization of pattern components like necklines and target lines, and customizable alerts delivered via sound, pop-up, Telegram, or email. It features color-coded insights to distinguish bullish, bearish, and neutral patterns, a pattern list with occurrence statistics, adjustable zoom levels for detailed analysis, and profit potential display to evaluate trade opportunities. Alerts provide clear symbol and timeframe information, and users can pause notifications or add personal notes for strategy refinement.
This tool assists traders in technical analysis and risk management by providing actionable insights based on chart patterns. It is intended as a supportive tool and does not function as a standalone trading solution. Users must apply their own trading strategies and risk controls when using this indicator.
Avaliações de clientes
5 | 67 % | |
4 | 0 % | |
3 | 33 % | |
2 | 0 % | |
1 | 0 % |


![Logótipo de "[Stellar Strategies] Smart ADX"](https://cdn.ctrader.com/image/webp/af13b084-b6f6-41db-b7bc-c7e688b57b05_36929)


