
VegaXLR - RSI and StochRSI Alerts
Indicador
15 compras
Versão 1.0, Apr 2025
Windows, Mac
5.0
Avaliações: 3
Descrição
VegaXLR - RSI and StochRSI Alerts é um indicador cTrader que fornece alertas para eventos de RSI e StochRSI, mantendo os traders informados sobre mudanças no mercado. Ele notifica os usuários sobre níveis de sobrecompra/sobrevenda, cruzamentos da linha central e cruzamentos das linhas K/D, tudo com configurações personalizáveis.
Principais Características:
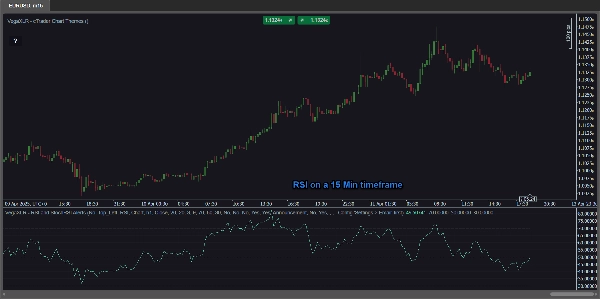
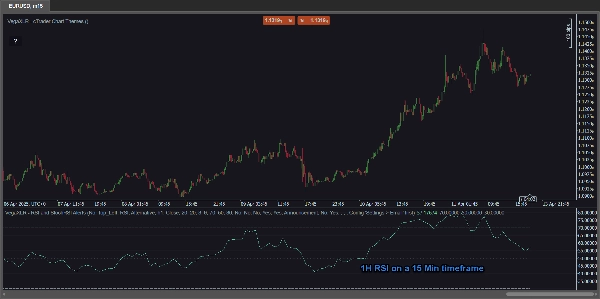
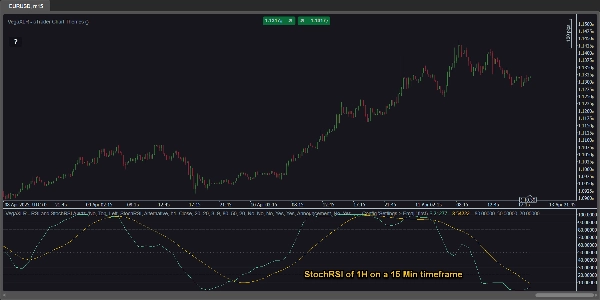
- Análise Multi-Temporal: Visualize de forma única os valores de RSI e StochRSI de qualquer período diretamente no seu gráfico atual. Por exemplo, analise o RSI de 1 hora enquanto visualiza um gráfico de 15 minutos—sem alterar o período do gráfico!
- Alertas de RSI & StochRSI: Receba notificações para:
-
- Condições de sobrecompra & sobrevenda
- Cruzamentos da linha central (50%)
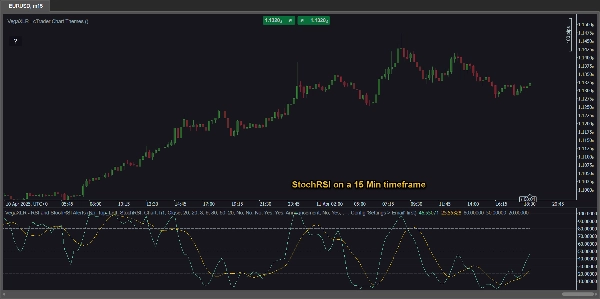
- Cruzamentos das linhas K e D (StochRSI)
- Configurações Personalizáveis: Ajuste a fonte do RSI, períodos, valores K/D e limites de alerta para controle preciso.
- Alertas Versáteis: Escolha entre:
-
- Pop-ups do cTrader
- Alertas sonoros
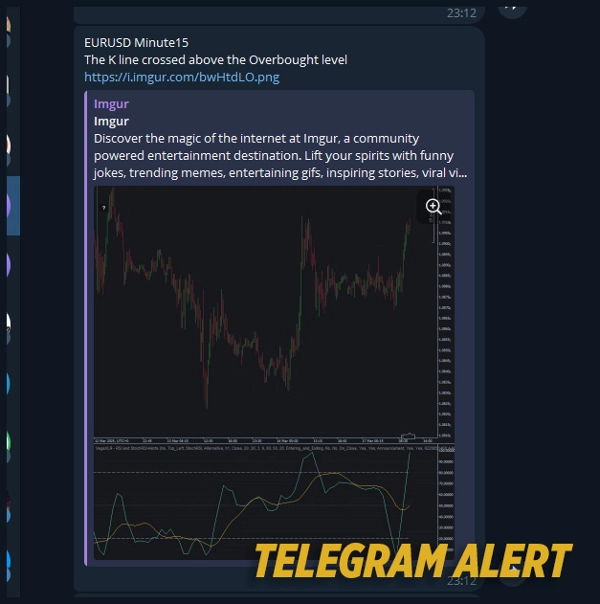
- Alertas no Telegram (com capturas de tela opcionais do gráfico)
- Notificações por e-mail
- Linhas Integradas de RSI & StochRSI: Não há necessidade de indicadores extras—eles já estão incorporados!
Guia de Acesso Instantâneo: Um botão conveniente no gráfico abre o manual do usuário.
Resumo
Resumo de IA
VegaXLR - RSI and StochRSI Alerts is a cTrader indicator designed to monitor and notify traders of key RSI and StochRSI events. It provides alerts for overbought and oversold conditions, centerline (50%) crossovers, and K/D line crossovers within the StochRSI. The indicator supports multi-timeframe analysis, allowing users to view RSI and StochRSI values from any timeframe directly on their current chart without switching timeframes. Customizable settings enable adjustment of RSI source, periods, K/D values, and alert thresholds for tailored monitoring. Alert delivery options include cTrader popups, sound alerts, Telegram notifications (with optional chart screenshots), and email messages. The indicator integrates RSI and StochRSI lines internally, eliminating the need for additional indicators. An in-chart button provides instant access to the user manual for guidance. This tool assists traders in identifying precise market shifts and potential trade entry points based on momentum indicators.
Perfil do indicador
Avaliações de clientes
5.0
Avaliações: 3
5 | 100 % | |
4 | 0 % | |
3 | 0 % | |
2 | 0 % | |
1 | 0 % |
Avaliações de clientes
April 27, 2025
Steady choice for testing for traders who use momentum confirmation. It gives value around oscillator setups, but strong trends can keep signals stretched. A clean test needs 25 oscillator signals, 2 timeframe confirmation and a clear 1R exit plan. The tool is useful when overbought or oversold is treated as context, not a command.
April 26, 2025
April 26, 2025
Good enough to inspect for oscillator setups. it gives a familiar read on overextension and momentum, especially when used for checking stretched conditions before entries. RSI style levels around 30 and 70 help, but I would add a 2 swing divergence check. The tool is useful when overbought or oversold is treated as context, not a command.
Conversa
Perguntas frequentes
RSI
Os produtos disponíveis através da cTrader Store, incluindo bots de negociação, indicadores e plugins, são fornecidos por programadores terceiros e são disponibilizados apenas para fins informativos e de acesso técnico. A cTrader Store não é um corretor e não fornece aconselhamento em matéria de investimento, recomendações pessoais ou qualquer garantia de desempenho no futuro.


Também poderá gostar de


![Logótipo de "[Stellar Strategies] Market Session Ultimate"](https://cdn.ctrader.com/image/webp/61ffd537-0125-4246-9e72-42eca1791d64_28232)
Preço
215
Vendas
677
Instalações gratuitas