
SwingHighLow
Indicador
10 compras
Versión 1.0, Jul 2025
Windows, Mac
4.3
Valoraciones: 3
Descripción
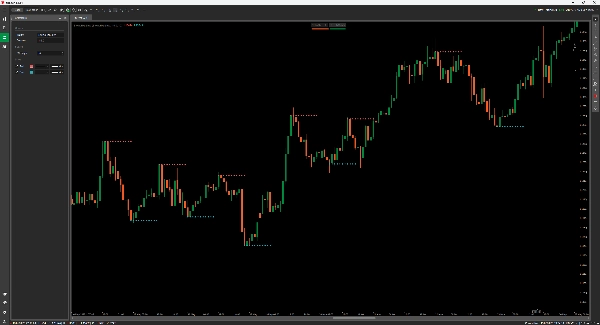
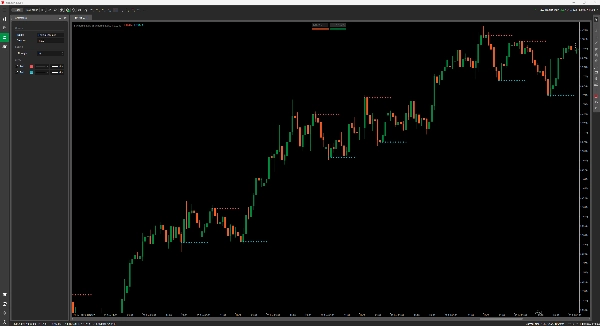
Indicador de Máximos/Mínimos Swing para cTrader
Mapea la Estructura del Mercado como un Profesional.
Este indicador de Máximos/Mínimos Swing detecta y traza automáticamente puntos de giro significativos en tu gráfico—perfecto para traders que dependen de la acción del precio, la estructura y las zonas de soporte/resistencia.
Características:
- Resalta máximos swing confirmados (rojo) y mínimos swing (azul) con trazados de puntos claros.
- El parámetro Fuerza ajustable te permite filtrar el ruido o afinar las señales.
- Ideal para análisis de tendencias, detección de reversiones y trampas de rupturas.
Funciona en todos los marcos temporales. Sin repintado. Solo estructura de mercado sólida, claramente marcada.
Resumen
Resumen de IA
The SwingHighLow indicator for cTrader automatically detects and plots significant swing highs and lows on price charts, aiding traders in identifying market structure, price reversals, and support/resistance zones. It highlights confirmed swing highs in red and swing lows in blue with clear point markers. The indicator includes an adjustable strength parameter that allows users to filter market noise or tighten signal sensitivity according to their trading preferences. It is suitable for use across all timeframes and supports analysis for various markets including Forex, indices, commodities, stocks, and cryptocurrencies such as BTCUSD, EURUSD, and XAUUSD. The tool is designed to assist with trend analysis, spotting reversals, and identifying breakout traps without repainting, providing consistent and reliable market structure visualization.
Perfil del indicador
Valoraciones de clientes
4.3
Valoraciones: 3
5 | 67 % | |
4 | 0 % | |
3 | 33 % | |
2 | 0 % | |
1 | 0 % |
Valoraciones de clientes
July 22, 2025
Good support for rules for swing point analysis. it helps identify turning points and cleaner structure, especially when used for reviewing reversals, pullbacks and swing zones. Swing points look better after 3 pivots, especially when the 0.5 Fib area agrees with structure. The level is useful when it supports the market story.
July 21, 2025
July 21, 2025
Practical choice for demo for a more controlled workflow. It helps with reviewing reversals, pullbacks and swing zones, but the signal still needs broader context. Swing points look better after 3 pivots, especially when the 0.5 Fib area agrees with structure. I would still keep manual review in the process.
Conversación
Preguntas frecuentes
BTCUSD
Forex
Signal
Breakout
Indices
EURUSD
Supertrend
Commodities
Stocks
XAUUSD
ATR
Los productos disponibles a través de cTrader Store, incluidos bots, indicadores y plugins para operar, son proporcionados por desarrolladores de terceros y están disponibles únicamente con fines informativos y de acceso técnico. cTrader Store no es un bróker, por lo que no proporciona asesoramiento de inversión, recomendaciones personales ni ninguna garantía de rentabilidad futura.


Precio
Desde 03/01/2025
638.03K
Volumen operado
21.34K
Pips ganados
15
Ventas