
Descripción
⚡ Características clave
- Detección dinámica de zonas
-
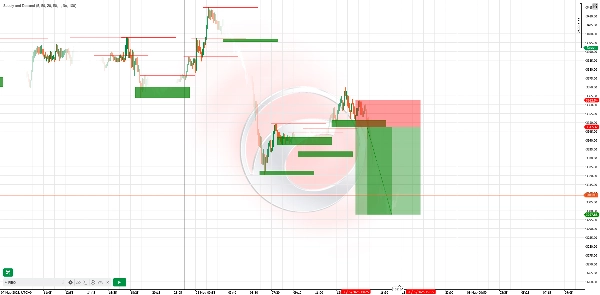
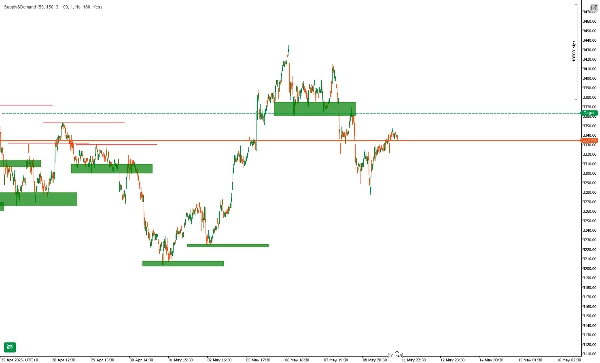
- Detecta automáticamente los máximos/mínimos de oscilación y dibuja zonas de oferta (resistencia) y demanda (soporte) en tiempo real.
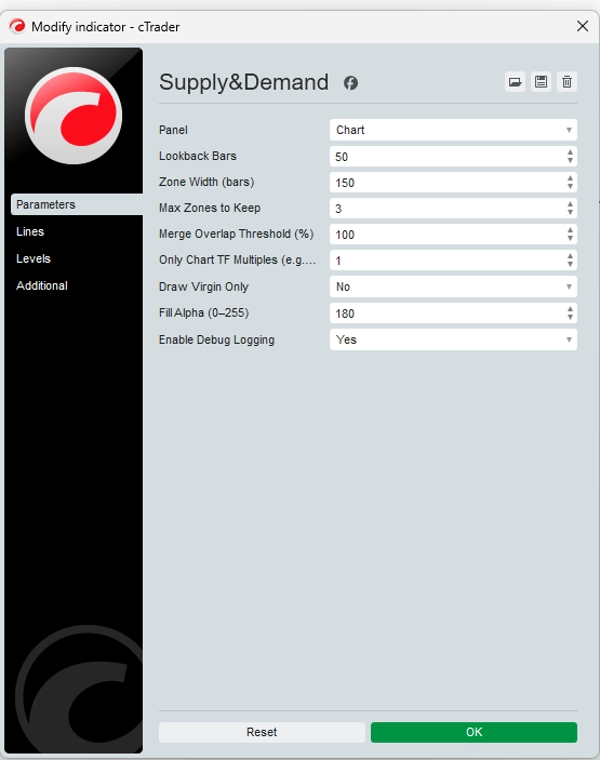
- Parámetros configurables de retroceso y ancho de zona que te permiten adaptar la sensibilidad para cualquier mercado o marco temporal.
- Resaltado de zonas vírgenes
-
- Las zonas “vírgenes” frescas (nunca tocadas por el precio) se enfatizan visualmente—opera donde las instituciones dejaron órdenes.
- Opcionalmente oculta las zonas tocadas para mantener tu gráfico despejado.
- Filtrado multitemporal
-
- Dibuja solo las zonas que coinciden con el múltiplo del marco temporal de tu gráfico (por ejemplo, muestra zonas diarias en tu gráfico de 1 hora).
- Visualiza rápidamente la confluencia de oferta/demanda de marcos temporales superiores con tu configuración intradía.
- No repinta y sin retrasos
-
- Las zonas se fijan una vez dibujadas—no desaparecen ni se desplazan después de que el precio se mueve.
- Fiabilidad comprobada: las zonas permanecen estáticas, dándote confianza en el análisis histórico.
- Alertas personalizadas y registro
-
- Recibe alertas emergentes o por correo electrónico cuando el precio entra o rompe una zona.
- Registro detallado de depuración muestra creación de zonas, solapamientos omitidos y toques de zona.
🚀 Cómo funciona
- Detección de pivotes: El indicador escanea cada nueva barra en busca de máximos pivote (oferta) y mínimos pivote (demanda) según el retroceso elegido.
- Construcción de zonas: Para cada pivote, se dibuja una zona rectangular que se extiende hacia adelante—resaltando donde probablemente las instituciones colocaron órdenes límite.
- Filtrado de solapamientos: Las zonas que se solapan más allá de tu umbral se fusionan o se omiten, asegurando que solo queden las áreas más significativas.
- Opción solo vírgenes: Mantén visibles solo las zonas intactas para enfocarte en los niveles institucionales más frescos.
🎯 Ejemplos de estrategias de trading
EstrategiaMarco temporalEntradaStop‑LossTake‑Profit
Rechazo de zona
H1
Espera a que el precio suba hacia una zona de demanda y muestre una vela bajista (envolvente/barra pin) en la zona de oferta
Justo más allá del límite de la zona
1.5× altura de la zona
Confluencia de marcos temporales
M15 + H4
Identifica la zona de demanda H4, luego cambia a M15 para una vela alcista dentro de esa zona
Por debajo del mínimo de la zona H4
Siguiente máximo de oscilación H4
Ruptura y retesteo
H4
Después de que el precio rompe una zona de oferta, espera el retesteo del lado inferior de la zona y la confirmación bajista
Por encima del tope de la zona
Mínimo reciente H4
Consejo de uso: Combina con divergencia RSI o MACD dentro de las zonas para señales de mayor probabilidad.
📈 Ejemplo en el mundo real
- En EURUSD H4, el indicador dibuja una zona de demanda en 1.0950–1.0980.
- El precio cae en la zona, imprime una vela envolvente alcista M15.
- Entrada en 1.0970, stop en 1.0945 (por debajo de la zona), objetivo en 1.1040 (siguiente resistencia H4).
- Resultado: +70 pips (~6.4× riesgo).
⚠️ Descargo de responsabilidad
Este indicador es una herramienta—no un sistema garantizado de ganancias. El rendimiento pasado no asegura resultados futuros. Siempre usa una gestión de riesgo adecuada (por ejemplo, máximo 2% por operación), prueba primero en una cuenta demo y combina con tu propio análisis. El trading conlleva riesgo de pérdida; opera solo con capital que puedas permitirte perder.
Resumen
It supports multi-timeframe filtering, allowing users to display zones aligned with higher timeframe multiples on lower timeframe charts, facilitating confluence analysis. Zones are non-repainting and non-lagging; once drawn, they remain fixed, ensuring reliable historical analysis. Custom alerts notify users when price enters or breaks these zones, and detailed logs track zone creation and interactions.
The indicator operates by scanning each new bar for pivot highs and lows, constructing rectangular zones extending forward, and filtering overlapping zones to retain the most significant areas. It offers a “virgin-only” mode to focus on fresh institutional levels.
Example strategies include zone rejection, multi-timeframe confluence, and break & retest setups, often combined with RSI or MACD divergence for higher-probability signals. A real-world example on EURUSD H4 demonstrates entry, stop-loss, and take-profit placement based on demand zones and candlestick confirmation.
Valoraciones de clientes
5 | 75 % | |
4 | 25 % | |
3 | 0 % | |
2 | 0 % | |
1 | 0 % |


![Logotipo de "[Hamster-Coder] Pivot Points MTF"](https://cdn.ctrader.com/image/webp/4c143e5a-309c-40e3-a578-f04d1e133ffa_31159)


