
Descripción
Support & Resistance Pro identifica zonas de soporte y resistencia y — a diferencia de la mayoría de las herramientas S/R — mide si esas zonas realmente funcionan, utilizando un motor estadístico independiente basado en datos históricos reales en lugar de suposiciones. Cada zona muestra una estadística de tasa de retención con un intervalo de confianza, calculada a partir de la población histórica completa de zonas, incluyendo zonas que luego se rompieron y desaparecieron del gráfico. La mayoría de los indicadores en esta categoría solo cuentan los niveles que aún son visibles hoy, lo que infla silenciosamente cada afirmación de fuerza realizada. Este no lo hace.
Características clave
- Zonas validadas estadísticamente Cada zona lleva una tasa de retención real, medida históricamente, con un intervalo de confianza del 95 % — no una puntuación de fuerza asumida. Una señal, el rechazo de mecha en el punto de contacto, ha sido formalmente validada: confirmada en EURUSD y Bitcoin, a través de múltiples marcos temporales, incluyendo una prueba genuina fuera de muestra donde el efecto mantuvo su fuerza en datos no vistos.
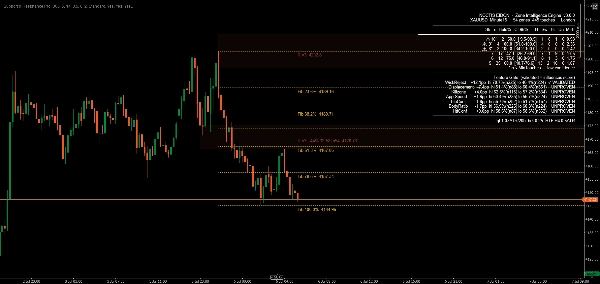
- Inversión automática de rol El soporte roto se convierte automáticamente en resistencia, y viceversa, con un marcador visual distinto — el indicador rastrea en qué lado del precio se encuentra una zona y la colorea en consecuencia, en lugar de fijar el color según cómo se formó originalmente la zona.
- Confluencia de marco temporal superior Las zonas en su gráfico se verifican contra un marco temporal superior de su elección, con la estructura HTF coincidente dibujada directamente en el gráfico como una superposición visual separada.
- Integración de retroceso de Fibonacci Niveles automáticos de retroceso de Fibonacci desde el último swing, cada uno etiquetado con la proporción y el precio exacto en la precisión nativa de su corredor, despejados automáticamente contra zonas cercanas para que las etiquetas nunca se superpongan.
- Advertencia de saturación Las zonas probadas demasiadas veces son señaladas en lugar de asumirse más fuertes — nuestros datos muestran que las zonas muy probadas tienden a desempeñarse peor, no mejor, probablemente porque su liquidez en reposo ya ha sido utilizada.
- Puerta de validación abierta Seis señales candidatas adicionales — proporción del cuerpo, velocidad de aproximación, temporización de sesión/zona de eliminación y prueba de desplazamiento — se muestran en vivo en el panel de estadísticas incorporado con sus propias lecturas de tasa de retención. No influyen en ninguna puntuación o clasificación hasta que cada una supere independientemente la misma barra de evidencia que el rechazo de mecha. Usted ve exactamente qué está probado y qué no.
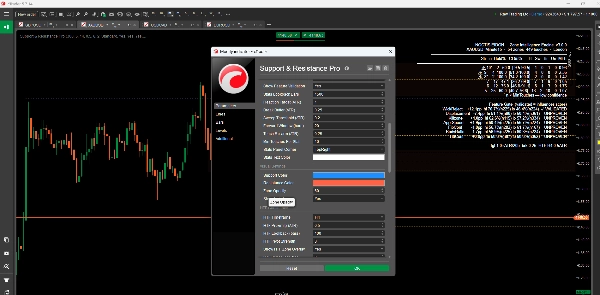
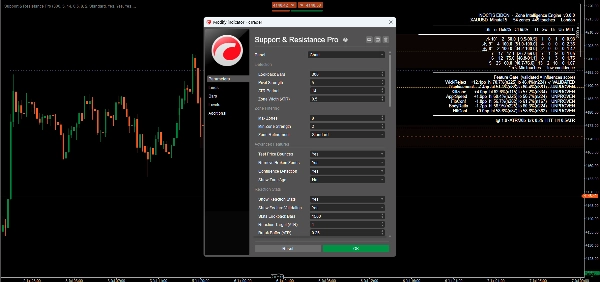
- Configuraciones personalizables Control extenso de parámetros en sensibilidad de detección, filtrado de zonas, estilo visual y comportamiento de alertas.
- Alertas en tiempo real Alertas configurables emergentes, por correo electrónico y de sonido para toques de zona, rupturas y eventos de confluencia, activables independientemente por canal.
Beneficios
- Evidencia sobre suposición: cada estadística en el gráfico puede ser verificada independientemente — el indicador incluye sus propias herramientas de verificación dentro y fuera de muestra
- Sin sesgo de supervivencia: las afirmaciones de fuerza se basan en la población histórica completa de zonas, no solo en los niveles que sobrevivieron
- Divulgación honesta: las señales probadas y no probadas están etiquetadas como tales, en el gráfico, en todo momento
Ideal para
Comerciantes que desean ver la evidencia estadística detrás de un nivel, no solo una línea — traders diarios, traders swing y traders sistemáticos en forex, criptomonedas y otros instrumentos que buscan un enfoque rigurosamente medido para soporte y resistencia.
Conclusión
Support & Resistance Pro se basa en un principio: una afirmación de fuerza no es real hasta que se mide. Una señal ha superado esa barra con confirmación cruzada entre instrumentos, marcos temporales y fuera de muestra. El resto se muestra honestamente como aún en prueba — porque un número que no puede verificar no vale la pena mostrarlo.
Resumen
- Dynamic support and resistance levels that adjust in real-time based on recent price action.
- Multi-timeframe analysis to view levels across different timeframes for a comprehensive market overview.
- Calculation and display of pivot points to mark potential intraday reversal zones and target prices.
- Highlighting of psychological price levels (round numbers) to gauge market sentiment.
- Integration of Fibonacci retracement levels to assist in identifying support and resistance during price corrections.
- Customizable settings for lookback periods, visualization styles, and color schemes to suit individual trading preferences.
- Clear graphical representation for easy identification of market conditions.
- Configurable real-time alerts when prices approach critical levels.
This indicator supports various trading styles including scalping, day trading, and swing trading, and is suitable for traders in forex, commodities, stocks, and indices markets. It is intended for both beginner and experienced traders seeking structured market analysis and enhanced decision-making through reliable support and resistance data.
Valoraciones de clientes
5 | 100 % | |
4 | 0 % | |
3 | 0 % | |
2 | 0 % | |
1 | 0 % |


