
Deskripsi
---------------------------------------------------------------------------------------
Pengumuman Pembaruan
Kami dengan senang hati mengumumkan pembaruan utama untuk indikator EnhancedSupportResistance kami! Pembaruan ini berfokus pada peningkatan penanganan objek grafik, memastikan bahwa anotasi dan gambar kustom Anda tetap utuh.
Apa yang Baru:
- Penghapusan Objek Selektif: Indikator kami sekarang hanya menghapus objek yang dibuatnya, mencegah penghapusan tidak sengaja objek grafik yang tidak terkait.
- Pengalaman Pengguna yang Ditingkatkan: Nikmati pengalaman yang lebih lancar dan lebih andal, dengan anotasi dan gambar penting Anda tetap tidak tersentuh oleh pembaruan indikator.
---------------------------------------------------------------------------------------
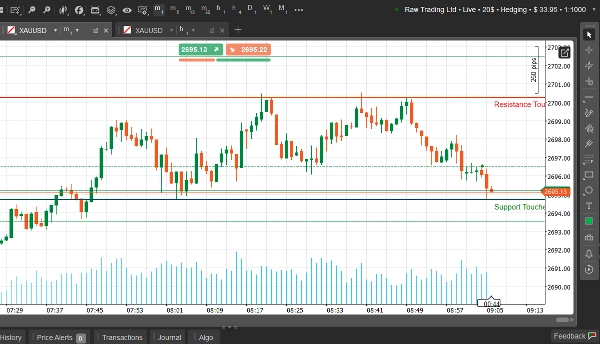
LevelMaster S/R - Kuasai Level Kunci Pasar
Deskripsi:
LevelMaster S/R adalah indikator trading yang kuat dan dirancang dengan presisi untuk memberi Anda keunggulan dengan mengidentifikasi level support dan resistance kritis secara akurat. Dibuat untuk trader dari semua tingkat, alat ini menganalisis aksi harga di seluruh timeframe pilihan Anda dan menyoroti zona yang paling relevan, membantu Anda membuat keputusan trading yang tepat dengan percaya diri.
Apakah Anda seorang scalper, day trader, atau swing trader, LevelMaster S/R memberikan wawasan yang Anda butuhkan untuk menavigasi pasar yang volatil dan menemukan peluang yang menguntungkan.
Fitur Utama:
🔥 Zona Support & Resistance yang Akurat
- Secara otomatis mendeteksi level terkuat berdasarkan aksi harga, fraktal, dan nilai ATR.
⏱ Analisis Multi-Timeframe
- Menganalisis dan menampilkan level kunci dari timeframe mana pun yang Anda pilih, langsung di grafik Anda.
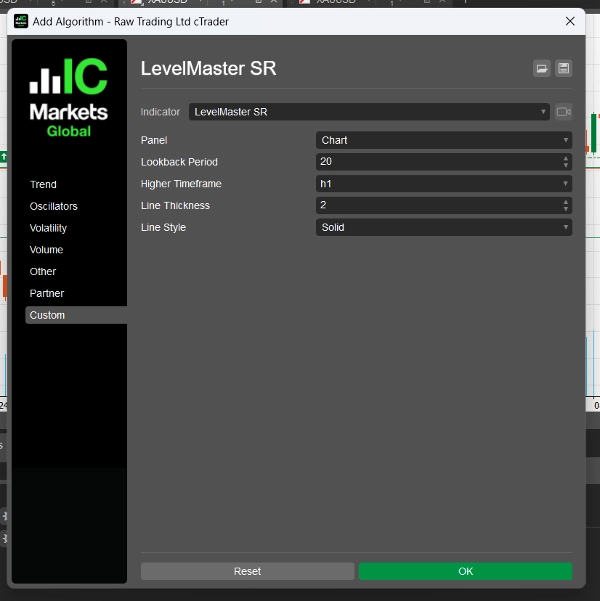
📊 Visual yang Dapat Disesuaikan
- Sesuaikan gaya garis, warna, dan ketebalan untuk integrasi grafik yang mulus.
🔔 Peringatan Waktu Nyata
- Dapatkan notifikasi melalui suara, email, atau ponsel saat harga mendekati level pilihan Anda.
💡 Pengaturan Ramah Pengguna
- Opsi input intuitif membuat pengaturan cepat dan mudah, bahkan untuk pemula.
Mengapa Memilih LevelMaster S/R?
✔ Pengambilan Keputusan yang Ditingkatkan: Berhenti menebak dan mulai trading dengan percaya diri.
✔ Hemat Waktu: Biarkan indikator melakukan pekerjaan berat dengan mengidentifikasi zona untuk Anda.
✔ Bekerja di Semua Pasar: Sempurna untuk Forex, Saham, Komoditas, dan Kripto.
✔ Dibuat oleh Trader, untuk Trader: Dirancang dengan fitur yang dibutuhkan trader sejati.
Siapa yang Harus Menggunakan LevelMaster S/R?
- Scalpers: Menentukan zona intraday untuk perdagangan cepat.
- Swing Traders: Menemukan level kuat untuk pergerakan harga yang lebih besar.
- Pemula: Menyederhanakan analisis pasar untuk pembelajaran yang mudah.
- Profesional: Meningkatkan strategi yang ada dengan data yang andal.
Ringkasan
Ulasan pelanggan
5 | 50 % | |
4 | 50 % | |
3 | 0 % | |
2 | 0 % | |
1 | 0 % |


![Logo "[Stellar Strategies] Inside Bar with Signals"](https://cdn.ctrader.com/image/webp/1d9e8bfa-3b2c-4440-bb37-5856902008a7_30683)