
Deskripsi
SmartFibonacci — Retracement & ekstensi Fibonacci otomatis dan dapat dikonfigurasi dengan dukungan timeframe lebih tinggi, label harga, dan peringatan kedekatan untuk keputusan perdagangan yang lebih cepat dan lebih percaya diri.
Deskripsi singkat siap toko (1–2 baris)
SmartFibonacci secara otomatis mendeteksi titik swing high/low dan menggambar retracement Fibonacci yang jelas serta ekstensi opsional pada grafik Anda. Pengaturan lookback yang dapat dikonfigurasi, deteksi swing timeframe lebih tinggi, label harga/persentase, dan peringatan kedekatan menjadikannya ideal untuk scalping intraday maupun setup swing.
Deskripsi produk lengkap (siap salin-tempel untuk cTrader Store)
SmartFibonacci adalah indikator cTrader ringan yang fokus pada performa dan mengotomatisasi analisis Fibonacci sehingga Anda dapat menghabiskan lebih sedikit waktu menggambar level dan lebih banyak waktu berdagang. Ini menemukan swing high dan swing low terbaru dalam lookback yang dapat dikonfigurasi, menggambar level retracement dan level proyeksi (ekstensi) opsional, serta menampilkan label harga dan persentase untuk interpretasi cepat. Untuk sinyal yang kuat, SmartFibonacci dapat menghitung titik swing pada timeframe lebih tinggi sambil menggambar level pada grafik Anda saat ini. Peringatan bawaan (popup + suara) memberi tahu Anda ketika harga mendekati jarak pip yang dapat dikonfigurasi dari level Fibonacci yang terlihat.
Daftar ini mencakup: tangkapan layar jelas yang menunjukkan elemen UI utama, contoh alur kerja, pengaturan konfigurasi, dan output contoh (label harga, ekstensi, peringatan) untuk memudahkan pembeli mengevaluasi fungsionalitas dan UX sebelum membeli.
Fitur utama
- Deteksi swing otomatis — menemukan swing high/low terbaru dalam jendela lookback yang dapat dikonfigurasi.
- Opsi swing timeframe lebih tinggi — menghitung pivot swing pada timeframe lebih tinggi untuk level yang lebih halus dan bermakna.
- Retracement & Ekstensi — menggambar garis retracement standar dan level proyeksi (ekstensi) opsional (persentase yang dapat ditentukan pengguna seperti 127.2, 161.8, dll.).
- Label harga & persentase — setiap level yang terlihat menunjukkan persentase dan harga tepat untuk pengambilan keputusan cepat.
- Visual yang dapat disesuaikan — atur warna (retracement / ekstensi), ketebalan garis, dan gaya garis.
- Peringatan kedekatan — popup + suara saat harga memasuki radius pip yang dapat dikonfigurasi dari level Fibonacci yang terlihat; opsi untuk memberi peringatan hanya pada level terdekat.
- Logika redraw efisien — indikator hanya menggambar ulang saat pivot swing berubah untuk mengurangi kekacauan grafik dan penggunaan CPU.
- Default aman — default yang masuk akal untuk trader yang ingin langsung menggunakan setelah instalasi.
- Kompatibel dengan cTrader / cAlgo — dirancang untuk dijalankan sebagai indikator overlay.
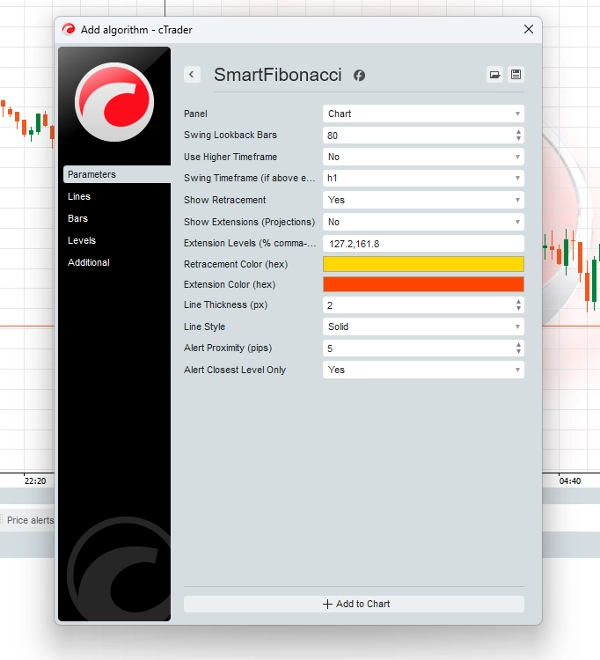
Konfigurasi (parameter & penjelasan)
- Swing Lookback Bars (int) — berapa banyak bar yang dicari ke belakang untuk menemukan swing high/low (default 80).
- Gunakan Timeframe Lebih Tinggi (bool) — aktifkan deteksi pada TF lebih tinggi saat menggambar pada grafik saat ini.
- Swing Timeframe (TimeFrame) — timeframe lebih tinggi yang digunakan saat
Gunakan Timeframe Lebih Tinggidiaktifkan. - Tampilkan Retracement (bool) — aktifkan atau nonaktifkan penggambaran level retracement.
- Tampilkan Ekstensi (bool) — aktifkan atau nonaktifkan penggambaran level ekstensi/proyeksi.
- Level Ekstensi (string) — nilai persentase yang dipisahkan koma (misalnya,
127.2,161.8) yang digunakan untuk mengisi garis proyeksi. - Warna Retracement / Warna Ekstensi (hex) — pilih warna untuk garis retracement dan ekstensi.
- Ketebalan Garis (px) — pengaturan ketebalan garis berupa integer.
- Gaya Garis (enum) — pilih solid, dashed, dll.
- Peringatan Kedekatan (pips) — jarak dalam pips untuk peringatan kedekatan.
- Peringatkan Hanya Level Terdekat (bool) — saat diaktifkan, hanya level fib terdekat yang memicu popup.
Output analitis & elemen UX
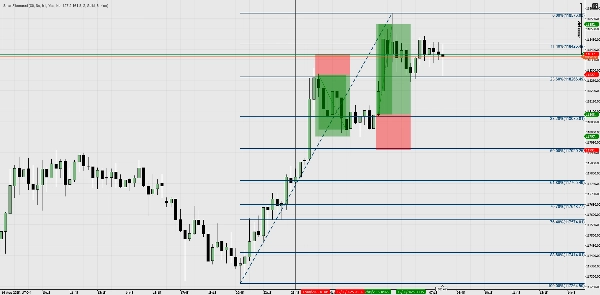
- Garis di grafik — garis retracement dan ekstensi dengan label persentase yang jelas (misalnya, 61.8%) dan label harga (misalnya, 1.23456).
- Notifikasi popup — pengguna menerima popup di layar dan suara sistem saat harga memasuki area
Peringatan Kedekatan. - Redraw tidak mengganggu — hanya memperbarui saat swing yang terdeteksi berubah untuk menghindari flicker redraw yang sering.
- Konsistensi sumber harga — peringatan dan label dihitung menggunakan seri Bars yang sama tempat fib digambar (penting saat menggunakan perhitungan timeframe lebih tinggi).
Contoh alur kerja / skenario penggunaan
- Pengaturan cepat (scalping / intraday)
-
- Pasang SmartFibonacci pada grafik 5 menit, atur
Lookback = 80,ShowRetrace = true. - Perhatikan level retracement dan gunakan 61.8% / 50% sebagai zona reaksi intraday.
- Aktifkan
Peringatan Kedekatan = 5 pipsuntuk mendapatkan notifikasi saat harga mendekati level penting.
- Pasang SmartFibonacci pada grafik 5 menit, atur
- Konteks timeframe lebih tinggi (swing trading)
-
- Atur
Gunakan Timeframe Lebih Tinggi = truedan pilihTimeframe Lebih Tinggi = H4(atau Daily). - Level mencerminkan swing H4 saat Anda berdagang di H1 atau M30 — penyelarasan lebih baik dengan struktur TF lebih tinggi.
- Gunakan ekstensi (127.2, 161.8) sebagai target keuntungan untuk perdagangan swing.
- Atur
- Validasi + konfluensi
-
- Gabungkan level SmartFibonacci dengan support/resistance, break struktur, atau moving averages yang sudah ada untuk memvalidasi entri.
- Gunakan peringatan popup untuk mengatur waktu entri atau catat interaksi untuk backtesting.
- Alur kerja berbasis peringatan
-
- Biarkan indikator aktif saat memantau beberapa grafik; terima popup saat harga mendekati level fib terlihat yang dikonfigurasi dan bertindak sesuai.
Ringkasan
Ulasan pelanggan
5 | 100 % | |
4 | 0 % | |
3 | 0 % | |
2 | 0 % | |
1 | 0 % |


