
Açıklama
Gelişmiş Destek Direnç Göstergesi
Teknik analiz gücünü Gelişmiş Destek Direnç Göstergemizle cAlgo için açığa çıkarın. Bu gelişmiş araç, tüccarların işlem grafiklerinde kritik destek ve direnç seviyelerini tanımlamalarına ve görselleştirmelerine yardımcı olmak üzere tasarlanmıştır; karar verme ve işlem stratejilerini geliştirir.
Ana Özellikler:
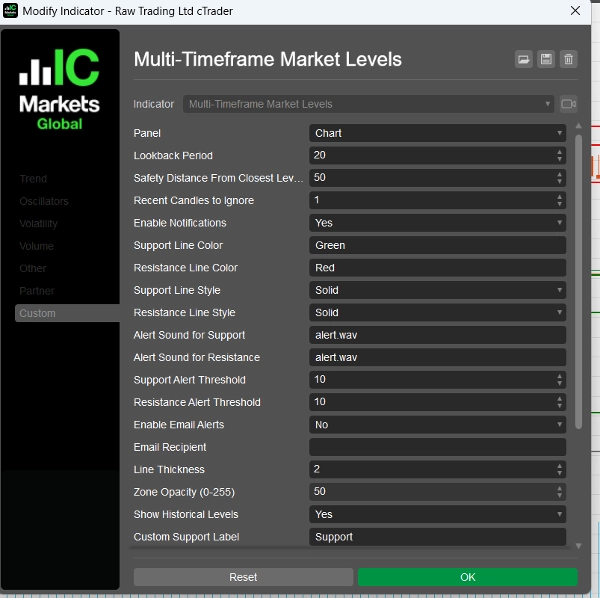
- Özelleştirilebilir Parametreler: Geriye dönük dönemler, güvenlik mesafeleri, uyarı sesleri ve daha fazlası dahil olmak üzere ayarlanabilir ayarlarla göstergenizi işlem tarzınıza göre uyarlayın.
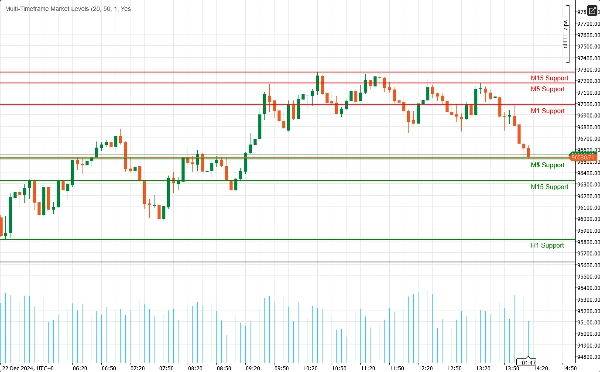
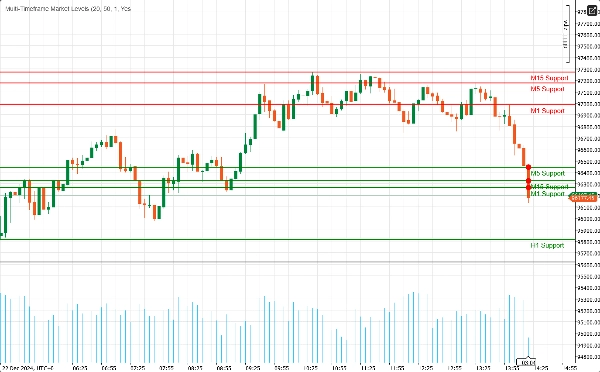
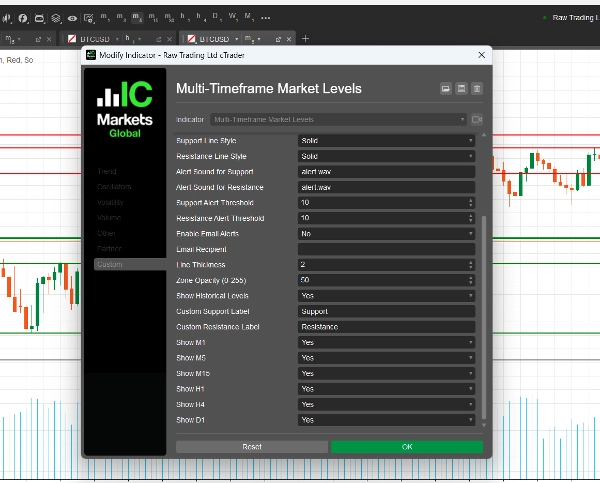
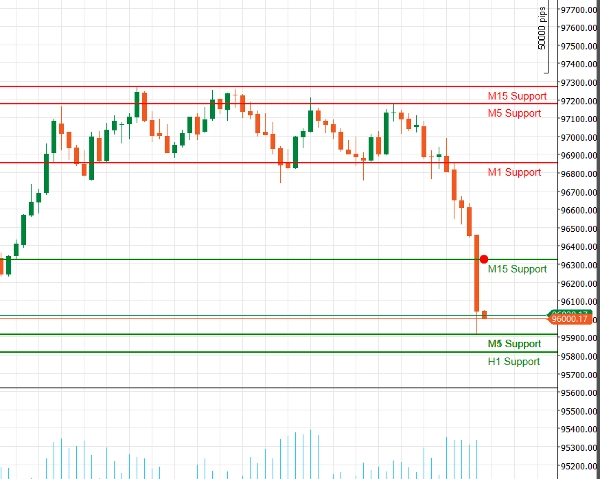
- Çoklu Zaman Dilimi Desteği: Piyasa dinamiklerine kapsamlı bir bakış kazanmak ve farklı işlem ufuklarında ana seviyeleri belirlemek için aynı anda birden fazla zaman dilimini (M1, M5, M15, H1, H4, D1) analiz edin.
- Gerçek Zamanlı Uyarılar: Anında bildirimlerle haberdar olun! Fiyat kritik destek veya direnç seviyelerine yaklaştığında gösterge sesli uyarılar ve e-posta bildirimleri gönderebilir, böylece hiçbir işlem fırsatını kaçırmazsınız.
- Görsel Netlik: Özelleştirilebilir renkler ve çizgi stilleri ile destek ve direnç seviyelerinin net görsel temsillerinin keyfini çıkarın. Vurgulanmış bölgeler ek bağlam sağlar, potansiyel dönüş noktalarını tespit etmeyi kolaylaştırır.
- Fibonacci Entegrasyonu: Destek ve dirençle birlikte potansiyel geri çekilme ve genişleme seviyelerini belirlemenize olanak tanıyan yerleşik Fibonacci seviye çizimi ile analizlerinizi geliştirin.
- Kullanıcı Dostu Arayüz: Hem yeni başlayanlar hem de deneyimli tüccarlar için tasarlanmış olan gösterge, kurulumu kolaydır ve mevcut cAlgo ortamınıza sorunsuz entegre olur.
Gelişmiş Destek Direnç Göstergesinin Kullanımı
- Kurulum:
-
- Göstergeleri indirip cAlgo platformunuza aktarın.
- Göstergeleri istediğiniz grafiğe ekleyin.
- Parametreleri Yapılandırma:
-
- İşlem tarzınıza uygun ayarları yapın. Geriye dönük dönemi, güvenlik mesafesini ayarlayın ve destek ile direnç seviyeleri için tercih ettiğiniz renkleri ve çizgi stillerini seçin.
- Fiyat bu seviyelere yaklaştığında uyarı almak isterseniz bildirimleri etkinleştirin.
- Zaman Dilimlerini Seçme:
-
- Hangi zaman dilimlerini göstermek istediğinizi seçin. İşlem stratejinize bağlı olarak M1, M5, M15, H1, H4 ve D1 seviyelerini gösterip gizlemeyi tercih edebilirsiniz.
- Grafiği Analiz Etme:
-
- Grafiğinizde çizilen destek ve direnç seviyelerini gözlemleyin. Bu seviyeler, fiyatın muhtemelen tersine döneceği veya konsolide olacağı yerleri gösterir.
Gelişmiş Destek Direnç Göstergesi ile Nasıl İşlem Yapılır
- Giriş Noktalarını Belirleme:
-
- Uzun İşlemler: Fiyat bir destek seviyesine yaklaştığında, özellikle geri sıçrama belirtileri gösteriyorsa (örneğin, yükseliş mum formasyonları), alım fırsatları arayın.
- Kısa İşlemler: Fiyat bir direnç seviyesine yaklaştığında, özellikle düşüş sinyalleri varsa (örneğin, düşüş mum formasyonları), satış yapmayı düşünün.
- Uyarıları Kullanma:
-
- Fiyat ana destek veya direnç seviyelerine yaklaştığında sizi bilgilendirmek için gerçek zamanlı uyarıları kullanın. Bu, hızlı hareket etmenizi ve potansiyel işlem fırsatlarından yararlanmanızı sağlar.
- Diğer Göstergelerle Birleştirme:
-
- Gelişmiş Destek Direnç Göstergesini diğer teknik göstergelerle (örneğin, Hareketli Ortalamalar, RSI, MACD) birleştirerek sinyalleri doğrulayın ve işlemlerinizin doğruluğunu artırın.
- Stop-Loss ve Take-Profit Seviyelerini Belirleme:
-
- Risk yönetimi için uzun işlemlerinizde stop-loss emirlerini destek seviyelerinin hemen altına, kısa işlemlerinizde ise direnç seviyelerinin hemen üstüne yerleştirin.
- Potansiyel kazançları maksimize etmek için take-profit hedeflerini bir sonraki önemli destek veya direnç seviyesinde belirleyin.
Neden Gelişmiş Destek Direnç’i Seçmelisiniz?
Finansal piyasaların karmaşıklıklarında gezinmek zor olabilir. Gelişmiş Destek Direnç Göstergesi, ana fiyat seviyelerini tanımlamanız ve bilinçli işlem kararları vermeniz için ihtiyacınız olan araçları sağlar. İster günlük tüccar olun ister uzun vadeli yatırımcı, bu gösterge işlem araç setinizin vazgeçilmez bir parçasıdır.
Özet
Müşteri değerlendirmeleri
5 | 100 % | |
4 | 0 % | |
3 | 0 % | |
2 | 0 % | |
1 | 0 % |


