
Deskripsi
🏆 10.000+ Trader Mempercayai Suite Algoritma Kami yang Berjumlah 25+! 🏆
Dari Struktur Pasar & Likuiditas ke Sistem Keluar Pintar & Alat Prediktif - kami telah membangun SETIAP alat yang Anda butuhkan untuk konsistensi.
👉 Akses Semua 25+ Sistem TERBUKTI:
_______________________________________________
📌 Indikator Struktur Pasar
· ✅ AdvancedMarket Structure: Bos, Choch, SwinLevels, Order Blocks, Market Structure& Liquidity Finder
· 🔄 Dynamic Market StructureAnalysis of Turning Points
· 🧱 Order Block
· ⚖️ Market Imbalance
· ⛓️ BOS & CHOCH
· 🧠 ICT Power of 3
_______________________________________________
🔚 Sistem Keluar Pintar
_______________________________________________
📐 Indikator ZigZag
· 🔍 ZigZag Price LiquidityProjection
· ➖ ZigZag
_______________________________________________
🧱 Indikator Support & Resistance
· 🟩 SmartTrend Support &Resistance Lines
· 🧱 All Support and ResistanceLevels
_______________________________________________
📊 Indikator Tren & Saluran
· 📊 Supertrend
_______________________________________________
💧 Alat Volume & Likuiditas
_______________________________________________
⚡ Indikator Momentum & RSI
· 🔎 Multi-Level Candle Bias
Tracker
_______________________________________________
🔮 Alat Prediksi & Proyeksi
· 📐 Prediksi Berdasarkan Linreg& ATR
· 📏 Fibonacci Linear RegressionMulti-timeframe
· 📈 Volume-Powered Market Flow Projector_________________________
_________________________________________________________________________________________________
_________________________________________________________________________________________________
ZigZag Structure Pro – 🚀
Secara otomatis mengidentifikasi titik balik penting pasar (puncak dan lembah utama) dan menggambar zona support dan resistance dinamis yang diperbarui secara real-time. 🎯 Berbeda dengan level statis tradisional, indikator ini terus menyesuaikan dengan struktur harga yang berubah.
Untuk apa ini? ❓
Indikator ini adalah alat analisis teknikal profesional yang dirancang untuk:
- Mengidentifikasi level institusional: 🏛️ Secara otomatis mendeteksi titik di mana harga telah membentuk struktur tinggi dan rendah penting.
- Analisis struktur pasar: 📊 Mengklasifikasikan setiap pergerakan menurut metodologi struktur bullish/bearish (Higher Highs, Lower Lows, dll.).
- Proyeksi tren: 🔮 Memperpanjang garis tren ke masa depan untuk mengantisipasi zona reaksi harga potensial.
- Trading pembalikan dan kelanjutan: 💰 Level yang ditandai berfungsi sebagai referensi untuk entri, stop-loss, dan target keuntungan.
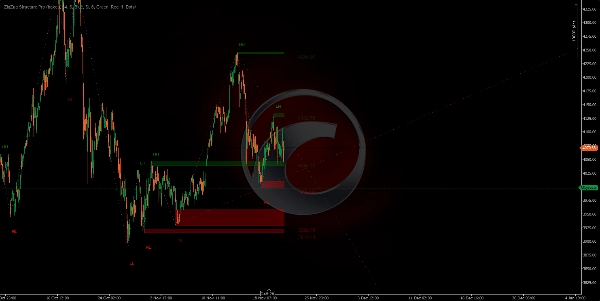
Indikator menggambar pada grafik Anda: ✍️
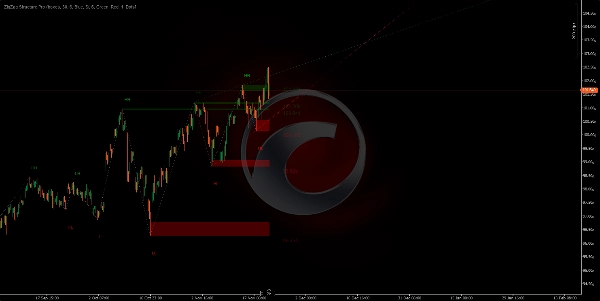
1. Zona Support/Resistance (Persegi Panjang)
- Zona hijau: 🟢 Menandai area support (lembah penting di mana harga bisa memantul).
- Zona merah: 🔴 Menandai area resistance (puncak penting di mana harga bisa berbalik).
- Zona-zona ini diproyeksikan ke depan, menunjukkan level aktif saat ini.
- Ketebalan setiap zona mewakili badan candle tempat pivot terbentuk.
https://chartshots.spotware.com/c/691f5a4d75ac4
https://chartshots.spotware.com/c/691f6b4f2e98b
https://chartshots.spotware.com/c/691f6c6fda808
https://chartshots.spotware.com/c/691f6d0aa6155
2. Garis Penghubung ⚡
- Menghubungkan setiap pivot dengan pivot berikutnya, menciptakan pola "zigzag" visual.
- Menghilangkan noise pasar, hanya menampilkan pergerakan yang benar-benar signifikan.
- Memudahkan untuk melihat arah dan struktur tren sekilas.
3. Garis Tren Proyeksi (Hijau/Merah Diperpanjang)
- Digambar dari pivot sebelumnya ke pivot saat ini dan diperpanjang ke masa depan.
- Hijau: 🟢 Garis tren bullish (dari lembah).
- Merah: 🔴 Garis tren bearish (dari puncak).
- Menampilkan 2 garis tren terbaru dan aktif.
- Berguna untuk mendeteksi breakout atau respek tren.
4. Label Struktur Pasar 🏷️
Setiap pivot menunjukkan label yang menunjukkan klasifikasinya:
- HH (Higher High): ↗️ Higher High - Kelanjutan bullish.
- LH (Lower High): ⬆️ Lower High - Kemungkinan pembalikan bearish.
- HL (Higher Low): ⬇️ Higher Low - Kemungkinan pembalikan bullish.
- LL (Lower Low): ↘️ Lower Low - Kelanjutan bearish.
Logika di balik algoritma 🧠
Indikator menggunakan algoritma zigzag adaptif yang:
- Memindai harga mencari puncak dan lembah dalam periode yang dapat dikonfigurasi (default 34 bar).
- Menyaring pergerakan yang tidak signifikan melalui ambang deviasi minimum (default 6 pips).
- Memvalidasi setiap pivot memastikan itu mewakili perubahan nyata dalam struktur pasar.
- Membandingkan struktur antara pivot berturut-turut untuk mengklasifikasikan jenis pergerakan.
- Memperbarui zona secara dinamis seiring munculnya pivot baru, menghapus yang paling lama.
Pengaturan Utama ⚙️
- Pivot Lookback Bars: Mengontrol sensitivitas detektor pivot (lebih rendah = lebih banyak pivot, lebih tinggi = hanya pivot utama).
- Filter Deviasi Harga: Filter noise - pergerakan yang lebih kecil dari nilai ini diabaikan.
- Jumlah Zona Terlihat Maksimum: Jumlah level historis yang tetap terlihat (dari 1 sampai 20).
- Tipe Tampilan Zona: Pilih antara persegi panjang (zona penuh) atau garis sederhana.
- Tampilkan Garis Tren Diperpanjang: Aktifkan/nonaktifkan proyeksi tren.
Panduan Parameter Cepat 📖
Pivot Lookback Bars (Default: 30)
- ↑ Tingkatkan (40-100): Lebih SEDIKIT pivot, lebih penting. Untuk swing trading.
- ↓ Turunkan (15-25): Lebih BANYAK pivot, lebih banyak sinyal. Untuk scalping/day trading.
Filter Deviasi Harga (Default: 6)
- ↑ Tingkatkan (8-15): Menyaring noise, hanya pergerakan besar. Lebih sedikit sinyal, kualitas lebih tinggi.
- ↓ Turunkan (2-5): Lebih sensitif, menangkap pergerakan kecil. Lebih banyak sinyal.
Jumlah Zona Terlihat Maksimum (Default: 6)
- ↑ Tingkatkan (10-20): Lebih banyak level historis terlihat. Untuk analisis mendalam.
- ↓ Turunkan (2-4): Hanya level terbaru. Grafik bersih.
Batas Pivot Historis (Default: 200)
- ↑ Tingkatkan (300-500): Lebih banyak sejarah untuk perhitungan. Analisis jangka panjang.
- ↓ Turunkan (50-150): Hanya struktur terbaru. Performa lebih baik.
Jumlah Proyeksi Aktif (Default: 5)
- ↑ Tingkatkan (5-10): Lebih banyak garis tren yang diproyeksikan.
- ↓ Turunkan (1-2): Hanya tren dominan. Lebih jelas.
Tampilkan Garis Tren Diperpanjang (Ya/Tidak)
- Aktif: Memproyeksikan tren ke masa depan.
- Nonaktif: Hanya zigzag historis.
🎯 Pengaturan Cepat
- Scalping: Lookback 15-20 | Deviasi 3-5 | Zona 3-4
- Day Trading: Lookback 25-35 | Deviasi 6-8 | Zona 5-6
- Swing Trading: Lookback 40-60 | Deviasi 10-15 | Zona 8-12
Ringkasan
Ulasan pelanggan
5 | 0 % | |
4 | 100 % | |
3 | 0 % | |
2 | 0 % | |
1 | 0 % |


