Deskripsi
Indikator Toko Pinescriptlabs: Toko cBots Pinescriptlabs : (cBot) Gold & BTC BreakoutSession Pivots(baru)
Prediksi Berdasarkan Linreg & ATR
SmartTrend Dukungan &
Resistensi
Garis
Analisis
Struktur Pasar
Dinamis
dari
Titik
Pembalikan
Regresi
Linear
Fibonacci
Multi-timeframe
Multi-Level
Pelacak Bias Lilin
Tracker
Dukungan
dan Resistensi
Otomatis
Garis Tren
Lines
Semua
Dukungan dan
Resistensi
Level
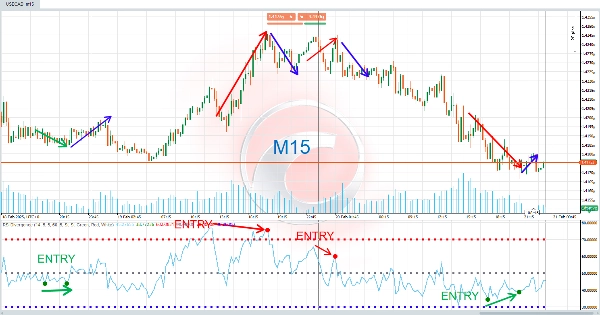
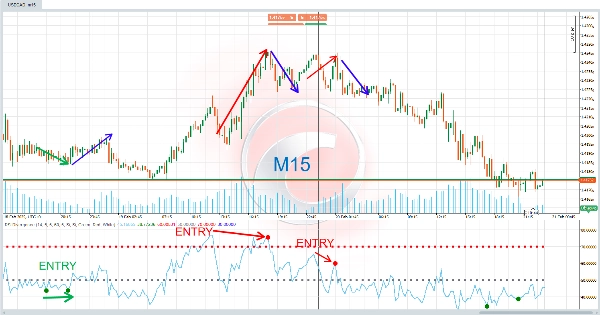
RSI Divergence adalah alat analisis teknis canggih yang dirancang untuk mendeteksi divergensi antara harga dan Indeks Kekuatan Relatif (RSI) . Divergensi ini adalah sinyal kuat yang dapat mengantisipasi perubahan arah pasar, menjadikannya sumber daya yang sangat berharga bagi para trader teknis. 🔍💡
⚙️ Bagaimana Cara Kerjanya?
Indikator ini beroperasi berdasarkan prinsip bahwa harga dan RSI tidak selalu bergerak secara sinkron. Ketika terjadi divergensi, itu berarti harga mengirimkan sinyal yang bertentangan dengan tren RSI yang mendasarinya. Ini bisa menjadi peringatan dini bahwa tren saat ini mungkin kehilangan kekuatan.
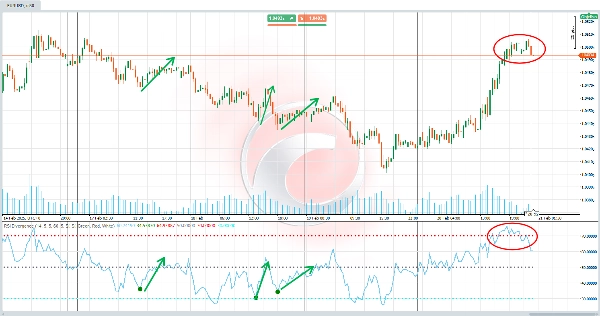
- Divergensi Bullish (Tren Naik) 📈 :
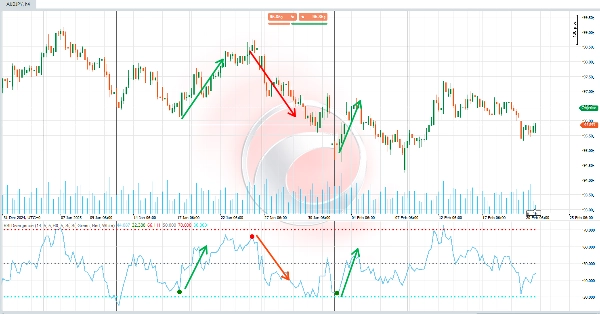
Terjadi ketika harga membentuk titik terendah yang lebih rendah , tetapi RSI membentuk titik terendah yang lebih tinggi . Ini menunjukkan bahwa, meskipun harga turun, momentum naik mungkin mulai menguat, yang berpotensi mengarah pada pembalikan ke atas. ✅ - Divergensi Bearish (Tren Turun) 📉 :
Terjadi ketika harga membentuk titik tertinggi yang lebih tinggi , tetapi RSI membentuk titik tertinggi yang lebih rendah . Ini menunjukkan bahwa, meskipun harga naik, momentum turun mungkin mulai menguat, yang berpotensi mengarah pada pembalikan ke bawah. ❌
Indikator secara otomatis mendeteksi divergensi ini dan menyorotnya pada grafik dengan warna, garis, dan label untuk memudahkan interpretasi. 🎯
💡 Untuk Apa Ini Digunakan?
Indikator ini sangat berguna untuk:
- Mengidentifikasi titik masuk dan keluar : Divergensi dapat berfungsi sebagai sinyal beli (bullish) atau jual (bearish). 🛒💸
- Mengantisipasi perubahan tren : Divergensi adalah sinyal awal bahwa tren saat ini mungkin kehilangan kekuatan. ⚡
- Mengonfirmasi analisis teknis : Dapat digunakan bersama indikator lain atau pola candlestick untuk memvalidasi keputusan trading. 🧠📊
Ini ideal untuk trader intraday maupun investor jangka panjang, karena divergensi berlaku untuk semua kerangka waktu. ⏳📈
🛠️ Bagaimana Cara Menggunakannya?
- Pengaturan Awal:
-
- Sesuaikan parameter sesuai kebutuhan Anda, seperti periode RSI, rentang pencarian pivot, dan warna sinyal. 🎨⚙️
- Aktifkan atau nonaktifkan tampilan divergensi bullish atau bearish sesuai preferensi Anda. ✅❌
- Menginterpretasikan Sinyal:
-
- Divergensi Bullish : Ketika sinyal "D" hijau muncul di grafik, itu menunjukkan kemungkinan peluang beli. 🟩🛒
- Divergensi Bearish : Ketika sinyal "D" merah muncul di grafik, itu menunjukkan kemungkinan peluang jual. 🟥🚫
- Selain itu, garis yang menghubungkan titik-titik divergensi digambar untuk memudahkan analisis visual. 📐🔗
- Pengambilan Keputusan:
-
- Gunakan sinyal ini untuk menyesuaikan strategi Anda, seperti membuka posisi, menutup perdagangan yang ada, atau menyesuaikan level stop-loss. 🤝💼
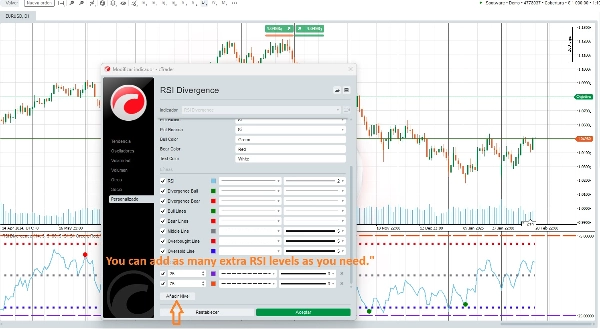
🆕 Kustomisasi Lanjutan!
🌟 Anda dapat menambahkan sebanyak mungkin level RSI sesuai keinginan pengguna 🌟
Indikator ini memungkinkan Anda untuk sepenuhnya menyesuaikan pengalaman trading Anda. Anda dapat menambahkan beberapa level RSI untuk menyesuaikannya dengan berbagai strategi dan gaya trading. Misalnya, Anda dapat mengonfigurasi level overbought dan oversold tambahan atau bahkan menyesuaikan periode RSI agar sesuai dengan kerangka waktu yang berbeda. 🔄📈📉
Ringkasan
Designed for use on any timeframe, the indicator helps traders identify entry and exit points, anticipate trend changes, and confirm other technical analysis signals. Users can customize parameters such as RSI period, pivot search ranges, signal colors, and enable or disable specific divergence types. Additionally, multiple RSI levels can be added to tailor the indicator to various trading strategies and styles.
This tool is suitable for intraday traders and long-term investors across markets including cryptocurrencies (e.g., BTCUSD), commodities (e.g., gold, XAUUSD), and indices. It supports enhanced decision-making by providing early warnings of trend strength shifts based on RSI divergence analysis.
Ulasan pelanggan
5 | 0 % | |
4 | 100 % | |
3 | 0 % | |
2 | 0 % | |
1 | 0 % |