
Deskripsi
🚀 Lebih dari 10.000 trader sudah menggunakan indikator TOP kami 🏆
Temukan mengapa para profesional memilih kami – alat paling kuat di cTrader (indikator, algoritma, dan cBots) menunggu Anda.
👉 Dapatkan semua sistem TOP kami di sini:
_______________________________________________
📌 Indikator Struktur Pasar
· ✅ AdvancedMarket Structure: Bos, Choch, SwinLevels, Order Blocks, Market Structure& Liquidity Finder
· 🔄 Dynamic Market StructureAnalysis of Turning Points
· 🧱 Order Block
· ⚖️ Market Imbalance
· ⛓️ BOS & CHOCH
· 🧠 ICT Power of 3
_______________________________________________
🔚 Sistem Keluar Pintar
_______________________________________________
📐 Indikator ZigZag
· 🔍 Proyeksi Likuiditas Harga ZigZag
· ➖ ZigZag
· 🎯 Pelacak Ekstremitas Zig-Zag
_______________________________________________
🧱 Indikator Support & Resistance
· 🟩 Garis Support & Resistance SmartTrend
· 🧱 Semua Level Support dan Resistance
_______________________________________________
📊 Indikator Tren & Saluran
· 📊 Supertrend
· 🔁 Rata-Rata Bergerak Reaktif
_______________________________________________
💧 Alat Volume & Likuiditas
_______________________________________________
⚡ Indikator Momentum & RSI
· 📈 Pemicu Tren RSI
· 🔎 Pelacak Bias Lilin Multi-Level
Tracker
_______________________________________________
🔮 Alat Prediksi & Proyeksi
· 📐 Prediksi Berdasarkan Linreg& ATR
· 📏 Regresi Linear Fibonacci Multi-timeframe
· 📈 Proyektor Aliran Pasar Berbasis Volume
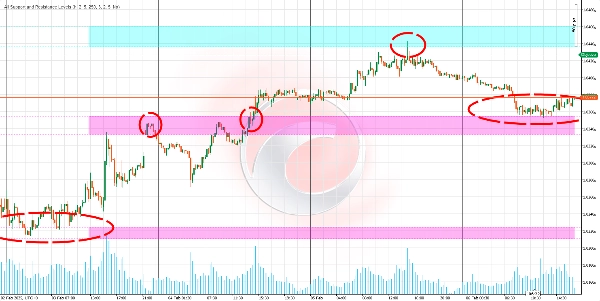
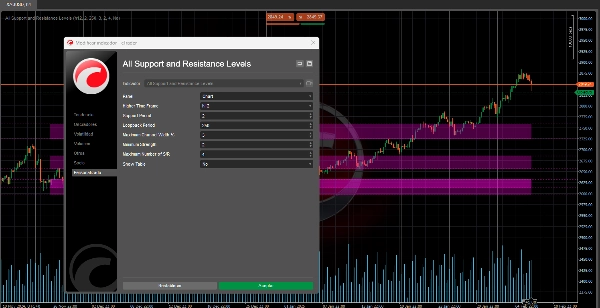
Algoritma ini adalah indikator support dan resistance canggih yang dirancang untuk membantu Anda mengidentifikasi level kunci di pasar.
Keunggulan utamanya adalah memungkinkan Anda melihat level support dan resistance dari timeframe mana pun (seperti harian, mingguan, atau bulanan) langsung pada grafik yang Anda analisis, bahkan jika berada pada timeframe yang berbeda (misalnya, 15 menit atau 1 jam). 📊⏰
Untuk apa ini? 🎯
Identifikasi zona pasar kunci:
- Deteksi level di mana harga mungkin berhenti, memantul, atau menembus dengan kekuatan. 🛑↗️↘️
- Membantu Anda membuat keputusan yang lebih tepat tentang entri, keluar, dan stop-loss. 💡📈📉
Analisis multi-timeframe tanpa berganti grafik:
- Lihat level penting dari timeframe yang lebih tinggi (seperti harian atau mingguan) saat trading di timeframe yang lebih rendah (seperti 15 menit atau 1 jam). 🕒📅
- Memberikan pandangan pasar yang lebih luas tanpa harus terus berganti grafik. 🌍🔍
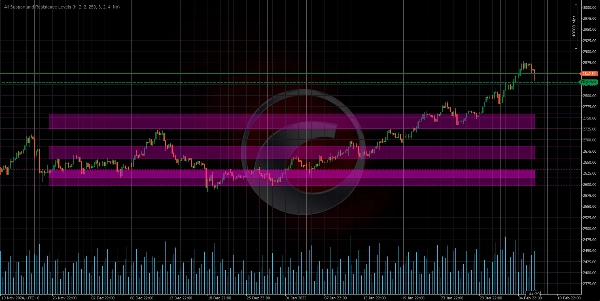
Prioritaskan level yang signifikan:
- Indikator memberi peringkat level support dan resistance berdasarkan "kekuatan" mereka, yaitu seberapa sering harga berinteraksi dengan level tersebut di masa lalu. 💪📊
- Ini membantu Anda fokus pada level yang paling relevan dan dapat diandalkan. 🎯✅
Bagaimana logikanya bekerja? 🧠⚙️
Pengumpulan Data:
- Indikator mengambil harga tertinggi dan terendah dari timeframe tertentu (harian, mingguan, dll.). 📈📉
- Data ini digunakan untuk mencari pola kunci dalam perilaku harga. 🔍📊
Deteksi titik kunci (pivot):
- Mengidentifikasi titik tertinggi dan terendah lokal—titik di mana harga mencapai puncak atau lembah dibandingkan harga di sekitarnya. ⛰️🌄
- Titik-titik ini menjadi kandidat untuk menjadi level support atau resistance. 🎯📌
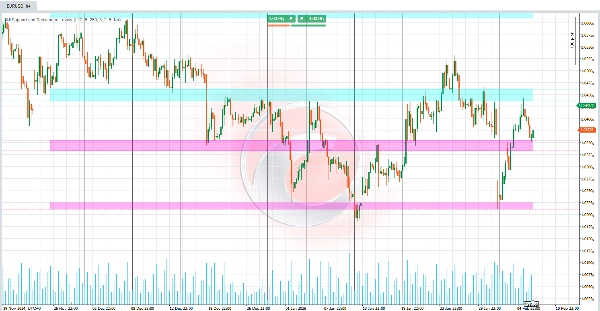
Pengelompokan level:
- Level yang berdekatan dikelompokkan untuk membentuk zona support atau resistance, bukan garis tepat. 🟦🟧
- Ini mencerminkan gagasan bahwa support dan resistance adalah area, bukan titik tepat. 📏🎯
Perhitungan kekuatan level:
"Kekuatan" sebuah level ditentukan oleh dua faktor:
- Frekuensi sentuhan: Berapa kali harga menyentuh atau mendekati level tersebut di masa lalu. 🔄📊
- Pengelompokan titik kunci: Berapa banyak titik tertinggi atau terendah yang dekat dengan level tersebut. 🔗📈
Level dengan kekuatan lebih besar dianggap lebih signifikan. 💪🎯
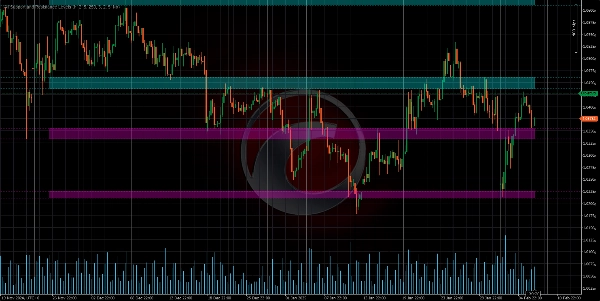
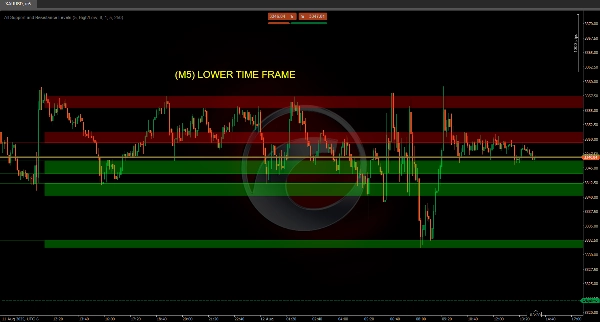
Visualisasi grafik:
- Level digambar sebagai garis horizontal atau zona berwarna pada grafik. 🎨📊
- Warna setiap level tergantung pada posisi harga saat ini:
-
- Resistance: Jika harga berada di bawah level. 🔴
- Support: Jika harga berada di atas level. 🟢
- Dalam rentang: Jika harga berada di dalam rentang level. 🟡
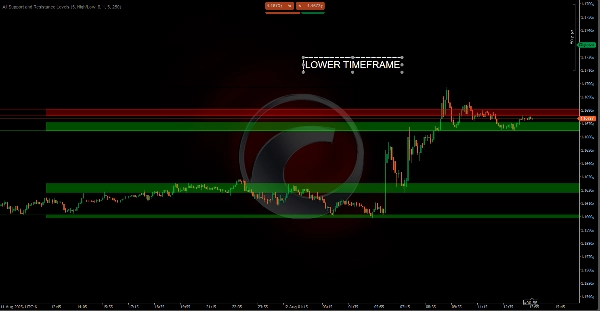
Bagaimana Anda dapat melihat timeframe berbeda pada grafik Anda? 🕒📊
Support dan resistance dari timeframe lebih tinggi pada grafik timeframe lebih rendah:
- Misalnya, jika Anda menganalisis grafik 15 menit, indikator dapat menampilkan level kunci dari timeframe harian atau mingguan. 🕒📅
- Ini memungkinkan Anda melihat level konteks lebih tinggi yang penting tanpa meninggalkan grafik saat ini. 🌍🔍
Support dan resistance dari timeframe lebih rendah pada grafik timeframe lebih tinggi:
- Meskipun kurang umum, Anda juga dapat melihat level dari timeframe yang lebih kecil (seperti 1 menit atau 5 menit) pada grafik timeframe lebih tinggi (seperti harian atau mingguan). 🕒📅
- Ini bisa berguna untuk analisis lebih rinci dalam konteks yang lebih luas. 🔍📊
Ringkasan
The indicator analyzes price data by collecting highs and lows from specified timeframes, identifying local pivot points where price peaks or valleys occur. These points are grouped into zones representing support or resistance areas rather than precise lines. Each level is assigned a strength score based on the frequency of price touches and the clustering of key points, helping users prioritize the most significant and reliable levels.
Visualized on the chart as horizontal lines or colored zones, the indicator uses color coding to indicate the price's position relative to each level: red for resistance (price below level), green for support (price above level), and yellow when price is within the level’s range. This tool assists traders in making informed decisions on entries, exits, and stop-loss placements by highlighting where price may stop, bounce, or break with strength.
Ulasan pelanggan
5 | 50 % | |
4 | 0 % | |
3 | 0 % | |
2 | 0 % | |
1 | 50 % |


![Logo "[Stellar Strategies] Inside Bar with Signals"](https://cdn.ctrader.com/image/webp/1d9e8bfa-3b2c-4440-bb37-5856902008a7_30683)


