
Deskripsi
Pinescritlabs
Indikator Toko Ctrader: 🤖Pinescritlabs cBots Toko Ctrader:
Sesi Celah Nilai Wajar Pivot Sesi Breakout Emas & BTC
Struktur Pasar Dinamis
Analisis Titik Balik
Fibonacci Linear
Regresi Multi-timeframe
Bias Lilin Multi-Level
Pelacak
Garis Tren Dukungan dan
Resistensi Otomatis
Semua Tingkat Dukungan dan
Resistensi
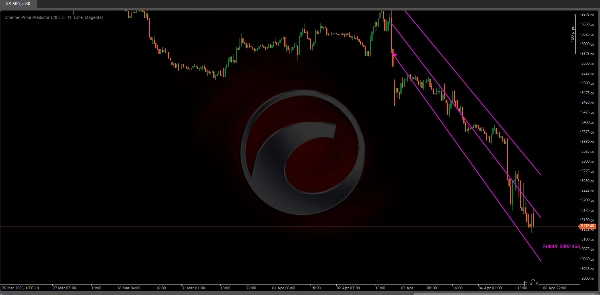
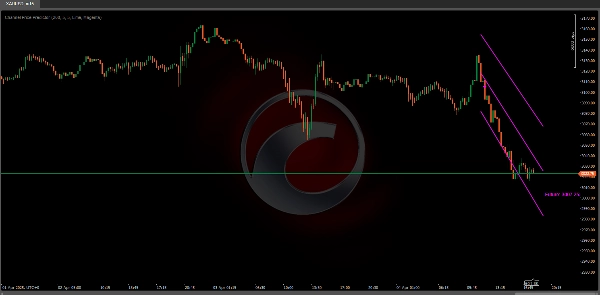
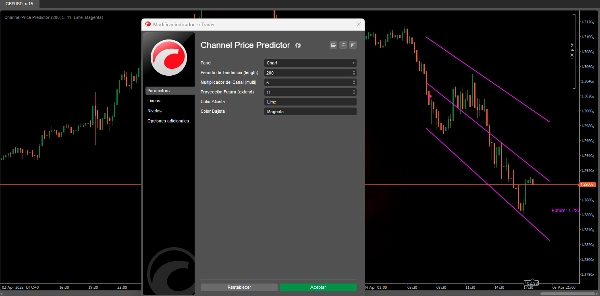
Prediktor Harga Saluran mengidentifikasi dan menggambar saluran tren (baik bullish atau bearish) pada grafik, memperluasnya ke masa depan untuk mengantisipasi zona harga yang mungkin. 📈🔮
Saluran ini didasarkan pada ATR (Average True Range), yang mengukur volatilitas pasar. Semakin tinggi volatilitas terbaru, semakin lebar saluran, membantu memvisualisasikan rentang pergerakan yang mungkin terjadi. 📊💥
Ini secara otomatis mengidentifikasi dan menggambar saluran berdasarkan pivot tertinggi dan terendah.
Opsi untuk memperpanjang garis saluran dan memproyeksikan harga masa depannya. 🕒📉
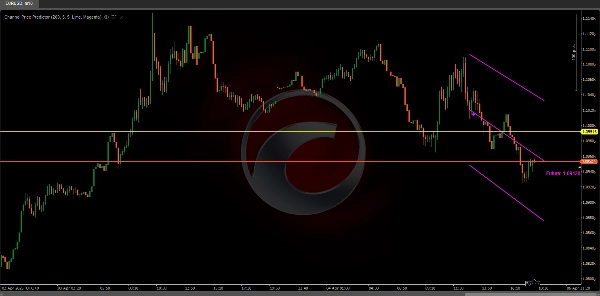
Saluran ini tidak hanya menunjukkan pergerakan saat ini tetapi juga memberi Anda proyeksi harga perkiraan untuk masa depan melalui label (“Masa Depan: …”) yang menunjukkan nilai harga yang mungkin. 📅💡
Untuk apa ini?
Identifikasi Tren:
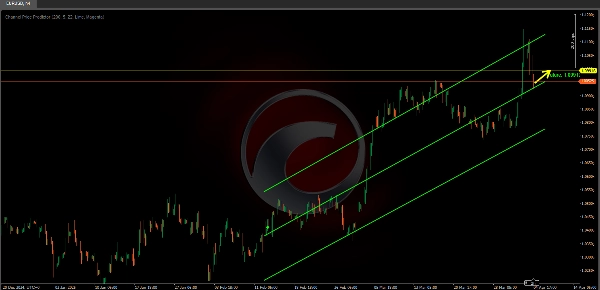
Indikator menggunakan logika internal untuk mendeteksi kapan pasar beralih dari bullish ke bearish (atau sebaliknya). Dengan cara ini, Anda dapat lebih jelas memvisualisasikan apakah aset berada dalam fase naik atau turun. 📈🔄📉
Saluran Volatilitas:
Saluran ini didasarkan pada ATR (Average True Range), yang mengukur volatilitas. Semakin tinggi volatilitas terbaru, semakin lebar saluran. Ini membantu Anda melihat rentang pergerakan yang mungkin. 📊🔍
Proyeksi Masa Depan:
Indikator ini tidak hanya menunjukkan tren saat ini tetapi memperpanjang saluran beberapa periode ke depan (dapat dikonfigurasi), sehingga Anda dapat mengantisipasi kemungkinan zona dukungan/resistensi dalam tren tersebut. ⏳🚀
Ini memungkinkan Anda memperpanjang garis saluran dan memproyeksikan harga masa depannya. ⬆️⬇️
Referensi Harga:
Dengan menggambar garis tengah dan tepi atas serta bawah, ini memberi Anda referensi untuk menempatkan stop, target, atau bahkan mengelola entri/keluar dengan informasi lebih tentang volatilitas. 🎯📍
Karena keterbatasan cTrader, saat ini tidak memungkinkan untuk menggulir ke kanan pada grafik untuk melihat ekstensi masa depan saluran dengan benar.
Disarankan untuk mengatur parameter “Proyeksi Masa Depan” ke nilai kurang dari 25 periode untuk menghindari masalah tampilan.
Setelah cTrader menerapkan kemampuan untuk memperluas grafik ke masa depan, kami akan melakukan perbaikan pada algoritma untuk memanfaatkan fungsi ini sepenuhnya.
Ringkasan
Key features include automatic detection of trend direction changes, visualization of current trend channels, and the ability to extend channel lines into the future. This future projection helps anticipate potential support and resistance zones by displaying estimated price values labeled as “Future: …”. The indicator draws a central line along with upper and lower channel boundaries, providing reference points for placing stops, targets, and managing trade entries and exits with volatility context.
Users can configure the number of periods for future projection, with a recommended maximum of 25 periods to avoid display issues due to cTrader platform limitations. The indicator supports analysis of various markets including cryptocurrencies (e.g., BTCUSD), commodities (e.g., XAUUSD), and others where volatility and trend identification are relevant.
Ulasan pelanggan
5 | 100 % | |
4 | 0 % | |
3 | 0 % | |
2 | 0 % | |
1 | 0 % |


