
Deskripsi
Deskripsi
Indikator Pinescriptlabs Store: 🤖 Pinescriptlabs Store cBots : (cBot)
Gold & BTC BreakoutSession Pivots(baru)
SmartTrend Support &
Resistance
Lines
Dynamic
Market Structure
Analysis
of
Turning Points
Fibonacci
Linear
Regression
Multi-timeframe
Multi-Level
Candle Bias
Tracker
Auto
Support and
Resistance
Trend
Lines
All
Support and
Resistance
Levels
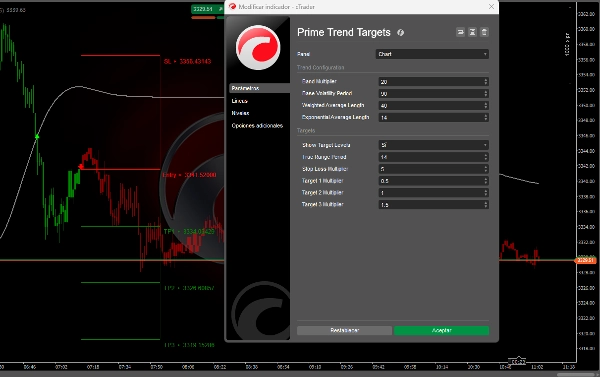
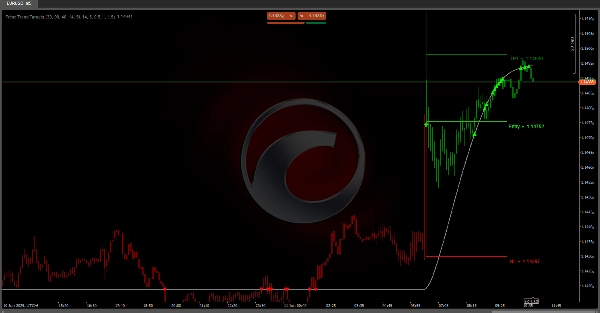
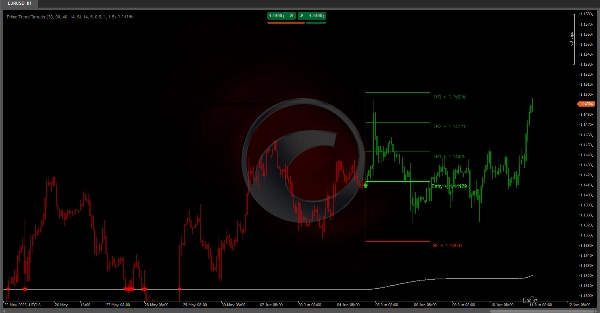
Prime Trend Targets :
menawarkan garis tren yang dihaluskan berdasarkan pita volatilitas (ATR) dengan logika persistensi, menyaring gangguan kecil. 🔄 Ini mendeteksi pembalikan tren dengan membandingkan nilai garis saat ini dengan nilai sebelumnya dan memvalidasi sinyal melalui jumlah penolakan saat harga berulang kali menguji garis tersebut. ✅ Setelah pergeseran fase dikonfirmasi, ini memproyeksikan entri, stop loss, dan hingga tiga target yang disesuaikan dengan volatilitas (ATR × pengali), menggambar level dan zona risiko/imbalan pada grafik. 🎨 Lilin diberi warna berdasarkan fase untuk kemudahan pembacaan.
⚙️ Dampak Parameter
• Sensitivitas lebih tinggi vs. ketahanan:
- 📉 Periode ATR & penghalusan yang lebih pendek bereaksi lebih cepat terhadap pembalikan tetapi menghasilkan lebih banyak gangguan.
- 📊 Periode yang lebih panjang menghaluskan sinyal palsu tetapi mungkin menunda deteksi.
- 🔍 Pengali yang lebih besar memperlebar pita & stop, mengurangi sinyal prematur tetapi meningkatkan keterlambatan atau kerugian jika pembalikan yang diharapkan gagal.
- 🎯 Target yang lebih kecil mengunci keuntungan sedang dengan cepat; target yang lebih besar menargetkan pergerakan yang lebih panjang tetapi dengan probabilitas keberhasilan lebih rendah.
• Penyetelan holistik: Gabungkan pengaturan volatilitas, pita, penghalusan, dan manajemen level untuk aset & kerangka waktu Anda.
✅Pedoman Operasional
• Uji coba kembali & uji demo secara menyeluruh—coba kombinasi berbeda dalam kondisi bervariasi (tren, ranging, volatilitas tinggi/rendah).
• Gabungkan dengan analisis lain: Support/resistance, pola candlestick, volume, atau indikator konfirmasi.
• Manajemen risiko: Ukuran posisi berdasarkan jarak stop untuk mempertahankan persentase risiko tetap.
• Disiplin & tinjauan berkala: Hindari over-optimasi untuk data masa lalu; sesuaikan saat kondisi pasar berubah.
Ringkasan
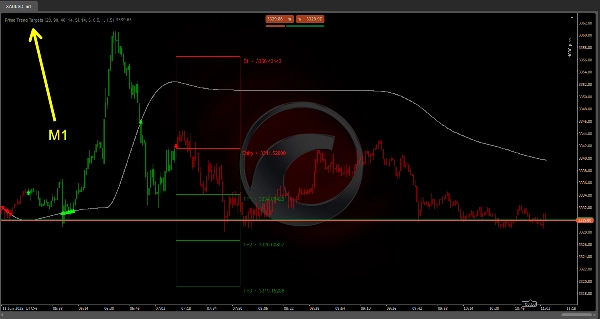
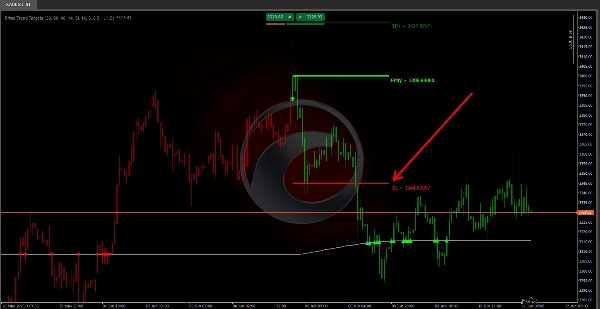
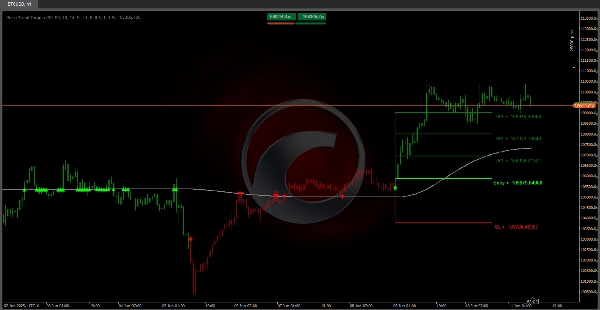
Upon confirming a phase shift, Prime Trend Targets projects key trading levels including entry points, stop loss, and up to three volatility-adjusted targets calculated as ATR multiplied by configurable multipliers. These levels are visually represented on the chart as risk/reward zones. Additionally, the indicator colors candles according to the current market phase for easier interpretation.
Users can adjust parameters to balance sensitivity and robustness: shorter ATR and smoothing periods increase responsiveness but may generate more noise, while longer periods reduce false signals but delay detection. Larger multipliers widen bands and stops, reducing premature signals but potentially increasing lag or losses if reversals fail. Target sizes can be set smaller for quicker gains or larger for extended moves with lower hit probability.
The indicator supports holistic tuning by combining volatility, band, smoothing, and level management settings tailored to specific assets and timeframes. Operational guidelines recommend thorough backtesting, combining with other analysis tools, applying risk management, and maintaining discipline with periodic reviews.
Ulasan pelanggan
5 | 0 % | |
4 | 100 % | |
3 | 0 % | |
2 | 0 % | |
1 | 0 % |


![Logo "[Stellar Strategies] Smart ADX"](https://cdn.ctrader.com/image/webp/af13b084-b6f6-41db-b7bc-c7e688b57b05_36929)
