Descrição
Indicadores da loja Pinescriptlabs: cBots da loja Pinescriptlabs : (cBot) Gold & BTC BreakoutSession Pivots(novo)
Projeção de Liquidez de Preço ZigZag
Algoritmo Inteligente de Trailing (novo)
Mapa de Liquidação de Alavancagem
Previsão Baseada em Linreg & ATR
SmartTrend Suporte &
Resistência
Linhas
Sistema de Rompimento de Canal
Análise
Dinâmica da Estrutura
de Mercado
dos
Pontos
de Virada
Regressão
Linear
Fibonacci
Multi-temporal
Gap de Valor Justo de Momentum
Gradiente de Tendência Dinâmico
Rastreador de
Viés de Velas
Multi-nível
Rastreador de Extremos Zig-Zag
Linha de Tendência
Automática de
Suporte e
Resistência
Linhas
Todos
os níveis de
Suporte e
Resistência
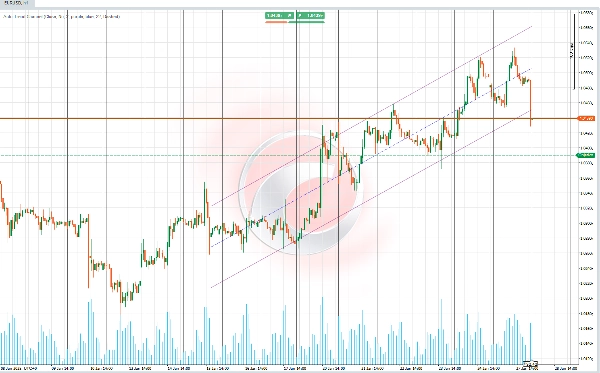
📊 Canal de Tendência Automático 📊
Este indicador traça um canal de tendência baseado no cálculo da regressão linear e no desvio padrão dos dados de preço (logarítmico) para um período selecionado automaticamente. 📈 O período é determinado usando o coeficiente de correlação de Pearson (RRR), escolhendo aquele com o maior valor absoluto. 🧮
✨ Funcionalidade Principal ✨
A funcionalidade principal é calcular um canal de tendência que se adapta automaticamente ao comprimento do período mais representativo, usando estatísticas avançadas para definir suporte, resistência, e a linha central de tendência.
O canal inclui:
1️⃣ Uma linha base representando a tendência linear calculada.
2️⃣ Linhas superior e inferior definindo as bandas do canal a uma distância proporcional ao desvio padrão.
🚀 Características e Cálculos 🚀
🔎 Cálculo do Período Ótimo
- O indicador avalia múltiplos períodos de dados (curtos ou longos, dependendo da configuração) para encontrar aquele com a correlação mais precisa ao comportamento do mercado.
- A correlação de Pearson é usada como métrica chave para identificar o período com a relação mais forte entre o preço histórico e a linha de tendência gerada.
📐 Regressão Linear e Projeção de Preço
- Para cada período avaliado, uma linha de regressão é calculada com base no logaritmo natural dos preços para estabilizar variações extremas.
- Componentes chave do cálculo incluem:
-
- Inclinação: Representa a taxa de variação do preço.
- Interceptação: O ponto inicial da linha projetada.
- Média: Estabelece uma linha base de referência.
📊 Desvio Padrão e Limites do Canal
- O desvio padrão dos preços em relação à linha de regressão é calculado.
- A banda superior (resistência) e a banda inferior (suporte) são derivadas ajustando a linha central com um multiplicador de desvio padrão configurável pelo usuário.
🌈 Visualização do Canal de Tendência
- O canal é composto por três elementos principais:
-
- Linha Central: Mostra a tendência principal baseada na linha de regressão.
- Linha Superior: Representa o limite superior do canal (resistência), ajustado pelo desvio padrão.
- Linha Inferior: Representa o limite inferior do canal (suporte), ajustado pelo desvio padrão.
- Os usuários podem personalizar as cores, transparência e estilos das linhas do canal para melhor clareza visual.
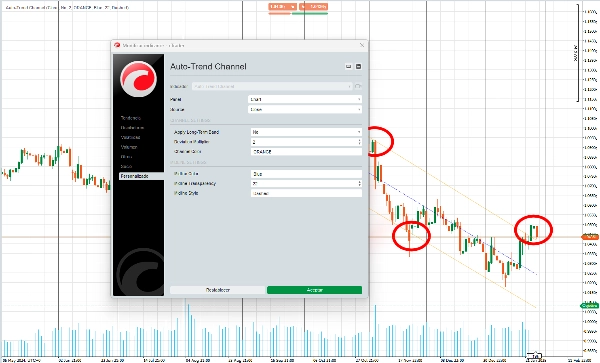
🎛️ Adaptabilidade e Configuração
- Os usuários podem personalizar vários aspectos do indicador, tais como:
-
- As cores das linhas e do canal.
- Se deve focar em períodos longos (tendências macro) ou períodos curtos (tendências micro).
- Essa adaptabilidade garante que o indicador se adeque a diferentes estilos de negociação e preferências visuais.
🔍 Uso :
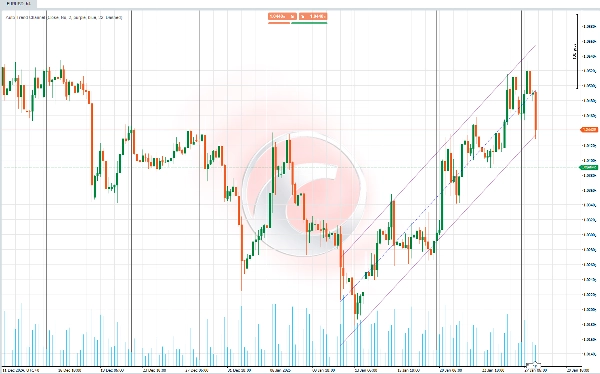
1️⃣ Identificação de Tendência
- A linha central do canal ajuda a determinar se o mercado está em uma tendência de alta, tendência de baixa, ou tendência lateral.
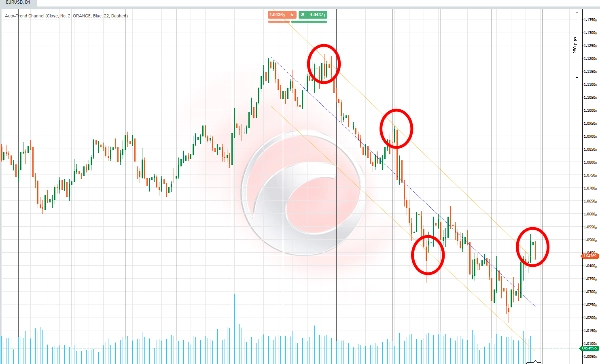
2️⃣ Suporte e Resistência Dinâmicos
- As linhas superior e inferior do canal atuam como zonas potenciais onde o preço pode reverter ou consolidar.
3️⃣ Detecção de Consolidação e Rompimento
- Preços permanecendo dentro do canal sugerem consolidação, enquanto um rompimento indica uma mudança de tendência ou um movimento forte de preço.
4️⃣ Ajuste a Diferentes Estilos de Negociação
- Períodos longos são úteis para identificar tendências gerais e tomar decisões estratégicas em prazos mais amplos.
- Períodos curtos permitem que os traders capturem movimentos mais rápidos e respondam a mudanças imediatas do mercado.
Resumo
Key features include:
- Optimal period selection by evaluating multiple data intervals to find the strongest correlation between historical prices and the trend line.
- Calculation of slope, intercept, and mean for precise linear regression and price projection.
- Visualization of the trend channel with customizable colors, transparency, and line styles.
- Adaptability for different trading styles by allowing focus on long-term (macro) or short-term (micro) trends.
Use cases:
- Identifying market trends (uptrend, downtrend, sideways) via the central trend line.
- Detecting dynamic support and resistance zones where price may reverse or consolidate.
- Recognizing consolidation phases within the channel and breakouts signaling trend changes or strong price movements.
- Adjusting analysis to suit strategic decisions or faster market responses depending on selected period length.
This indicator supports various markets including cryptocurrencies (BTCUSD), commodities (XAUUSD), and others, providing a statistical approach to trend and channel analysis.
Avaliações de clientes
5 | 60 % | |
4 | 20 % | |
3 | 20 % | |
2 | 0 % | |
1 | 0 % |


![Logótipo de "[Hamster-Coder] Pivot Points MTF"](https://cdn.ctrader.com/image/webp/4c143e5a-309c-40e3-a578-f04d1e133ffa_31159)

![Logótipo de "[CB] Pivot Points Pro"](https://cdn.ctrader.com/image/webp/43463c82-67b0-4f10-a4ba-901bba091d81_32594)