Descripción
El Índice de Presión de Velas (CPI) es un indicador potente pero fácil de usar diseñado para revelar la presión oculta de compra y venta detrás de cada vela. En lugar de simplemente mostrar si el precio subió o bajó, el CPI profundiza en qué tan fuertemente los compradores o vendedores controlaron el mercado dentro de cada vela. Esto lo convierte en una herramienta única para identificar la fuerza de la tendencia, detectar reversiones temprano y confirmar puntos de entrada o salida con mayor precisión.
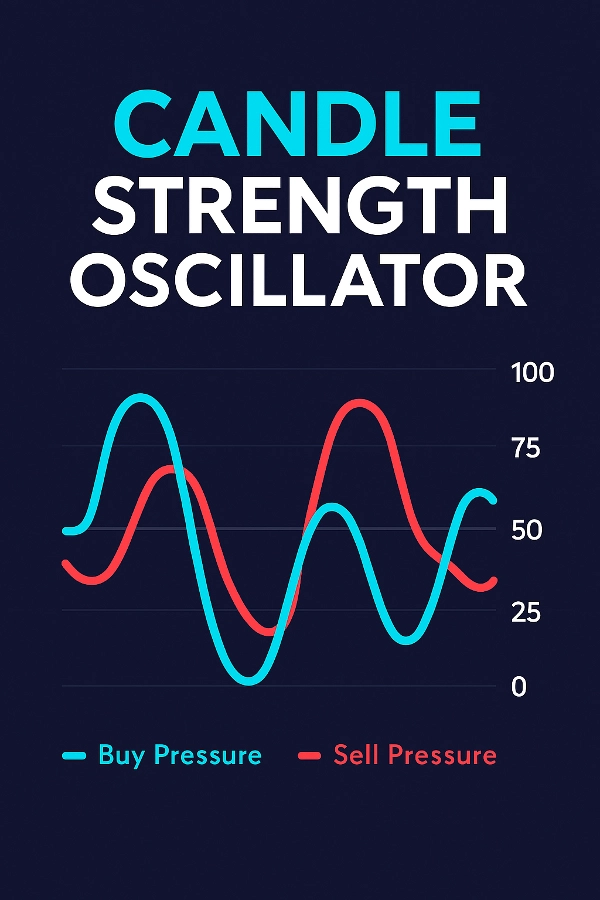
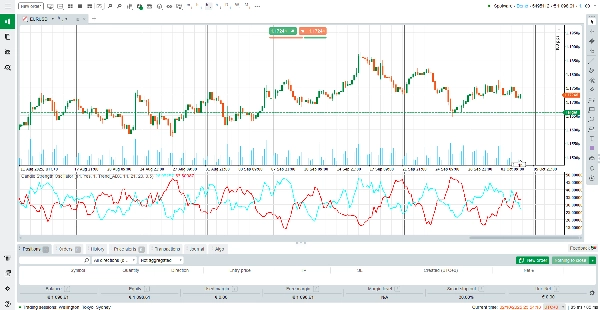
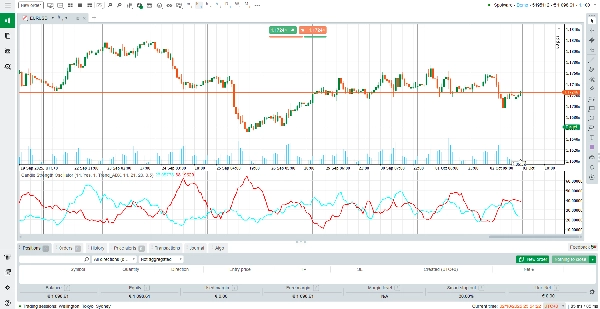
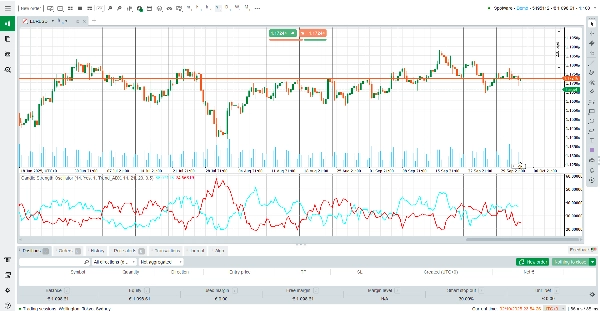
A diferencia de los osciladores tradicionales que solo reaccionan al precio, el CPI combina la dinámica del cuerpo de la vela, el momentum, el peso del volumen y el análisis de tendencia (ADX o EMA) para brindarte una visión completa de la presión del mercado. Con dos líneas suaves – Presión de Compra (cian) y Presión de Venta (rojo) – los traders pueden ver instantáneamente qué lado del mercado está en control.
Cómo Leer el Indicador
Presión de Compra (Línea Cian) – Representa la intensidad del control alcista. Una línea ascendente muestra un dominio creciente de los compradores.
Presión de Venta (Línea Roja) – Representa la intensidad del control bajista. Una línea ascendente muestra una fuerza de venta más fuerte.
Cruces – Cuando la línea de Compra cruza por encima de la línea de Venta, señala una presión alcista más fuerte (oportunidad potencial de compra). Cuando la línea de Venta cruza por encima, domina la presión bajista (oportunidad potencial de venta).
Zona de Nivel 50 – Lecturas alrededor del medio (≈50) indican equilibrio entre compradores y vendedores, mientras que lecturas extremas (por encima de 75 o por debajo de 25) muestran una fuerte presión direccional.
Impulso del Factor de Tendencia – El indicador adapta sus señales basándose en la confirmación de tendencia del ADX o la pendiente de la EMA, reduciendo señales falsas durante mercados laterales.
Cómo Funciona el Indicador
El CPI calcula la presión usando un modelo ponderado que considera:
Estructura de la vela: El tamaño del cuerpo y la posición del cierre en relación con el máximo/mínimo.
Momentum: Movimiento del precio comparado con la vela anterior.
Volumen: El peso del volumen de ticks asegura que los movimientos de alto volumen tengan más importancia.
Confirmación de tendencia: Ya sea la fuerza del ADX o la pendiente de la EMA añade un factor de impulso para alinear las señales con la tendencia predominante.
Suavizado: Un filtro SMA definido por el usuario asegura líneas suaves y estables sin perder capacidad de respuesta.
Esta fórmula avanzada significa que el CPI no solo reacciona al precio, sino que también entiende por qué el precio se mueve – dando a los traders una visión más profunda del comportamiento del mercado.
Características Clave
Visualización de Doble Línea – Compara instantáneamente la presión de compra vs. venta con líneas codificadas por color (cian para compradores, rojo para vendedores).
Impulso Adaptativo de Tendencia – Integra ADX o EMA para confirmar la dirección de la tendencia y reducir señales falsas.
Cálculo Consciente del Volumen – Ponderado por volumen de ticks para resaltar movimientos respaldados por la participación real del mercado.
Visualización Suavizada y Limpia – Filtro SMA incorporado para lecturas suaves sin distorsiones lentas.
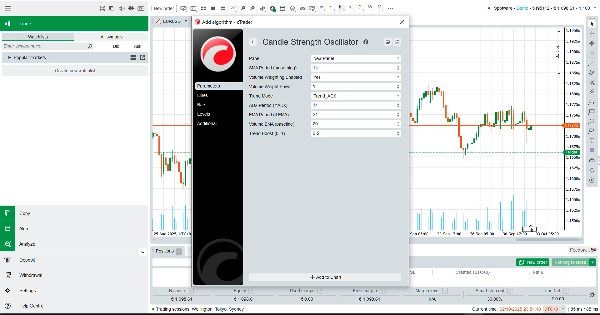
Totalmente Personalizable – Períodos ajustables, ponderación e intensidad de impulso para adaptarse a cualquier estilo de trading.
¿Por Qué Usar el Índice de Presión de Velas?
El CPI es perfecto para traders que quieren ir más allá de la simple acción del precio y ver la verdadera batalla entre compradores y vendedores. Ya seas un scalper, trader de swing o seguidor de tendencias, este indicador gratuito te brinda la claridad necesaria para cronometrar entradas, gestionar riesgos y mantenerte alineado con la verdadera dirección del mercado.
Descarga el Índice de Presión de Velas (CPI) hoy mismo – y opera con confianza entendiendo las fuerzas ocultas que impulsan cada vela.
Resumen
The indicator displays two smooth lines: Buy Pressure (cyan) and Sell Pressure (red). Crossovers between these lines signal shifts in market dominance, helping traders identify trend strength, potential reversals, and optimal entry or exit points. Readings near the midpoint indicate balance, while extremes suggest strong directional pressure.
CPI incorporates volume-weighted calculations and trend-based boosts to reduce false signals during sideways markets. It includes a smoothing filter for stable, responsive readings and offers customization of periods, weighting, and trend boost intensity.
This tool is applicable across various markets including Forex, commodities, stocks, and cryptocurrencies, supporting trading strategies such as scalping and breakout trading. It aims to provide traders with enhanced insight into market dynamics beyond simple price action.
Valoraciones de clientes
5 | 0 % | |
4 | 100 % | |
3 | 0 % | |
2 | 0 % | |
1 | 0 % |