
Description
Le KasePeakOscillator (KPO) est un outil d'analyse technique sophistiqué conçu pour identifier l'épuisement du marché, les retournements de tendance et les changements de momentum. Contrairement aux oscillateurs standards, le KPO intègre des mesures statistiques de volatilité pour fournir des signaux plus fiables dans des conditions de marché variées.
Comment ça fonctionne : L'indicateur calcule la relation entre l'action des prix et la volatilité historique (Average Daily Range/Standard Deviation). Il évalue les « Cycles Courts » par rapport aux « Cycles Longs » pour déterminer si un mouvement de prix est statistiquement significatif ou simplement du bruit de marché. Le résultat est un oscillateur fluide et réactif qui oscille autour d'une ligne zéro.
Composants clés :
- L'Histogramme (KCD) : Représente le momentum principal. Un croisement de la ligne zéro indique un changement dans la tendance à court terme.
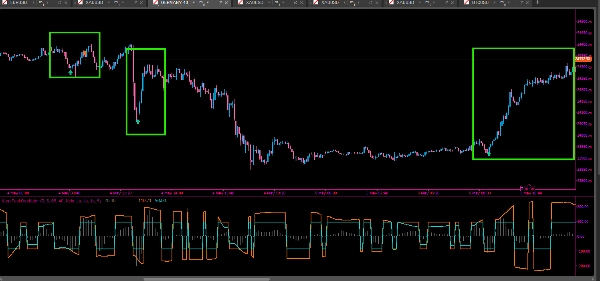
- Bandes Dynamiques (Supérieure/Milieu) : Celles-ci agissent comme des seuils statistiques de « surachat » et « survente ». Elles s'adaptent à la volatilité du marché, s'élargissant pendant les périodes d'activité élevée et se contractant lors de la consolidation.
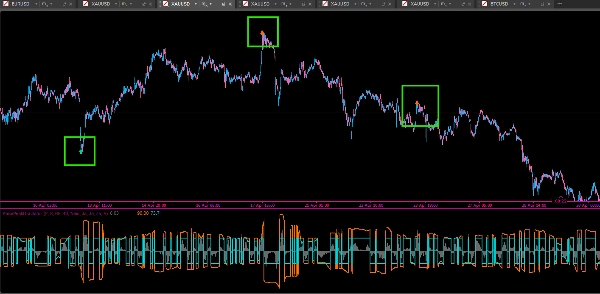
- Détection Automatique des Pics : L'indicateur identifie les « Pics » et les « Creux » où le momentum atteint un extrême statistique, signalant un épuisement potentiel.
Stratégie de Trading :
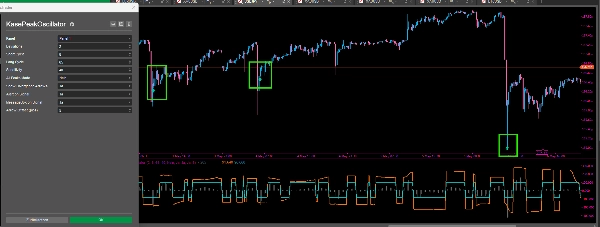
- Épuisement des Pics : Lorsqu'un pic de momentum se produit en dehors des bandes dynamiques (indiqué par des flèches Menthe ou Orange), cela suggère que la tendance actuelle est trop étendue et qu'un retournement ou une correction est probable.
- Signaux de Divergence : Le KPO identifie automatiquement les divergences haussières et baissières. Une divergence se produit lorsque le prix atteint un nouvel extrême mais que l'oscillateur ne le fait pas, indiquant un affaiblissement du momentum. Celles-ci sont marquées par Bleu Clair (Haussière) et Or (Baissière) icônes.
- Confirmation de Tendance : Utilisez la position de l'Histogramme par rapport à la ligne zéro pour confirmer la direction de la tendance. Rester au-dessus de zéro soutient les positions longues, tandis que rester en dessous soutient les positions courtes.
Fonctionnalités :
- Système d'alerte intégré (son, boîte de message et icônes visuelles).
- Sensibilité réglable pour correspondre à différentes classes d'actifs (Forex, Indices, Crypto).
- « Mode Tous les Pics » pour le scalping agressif ou mode filtré pour des configurations swing à haute probabilité.
Résumé
Key components include:
- Histogram (KCD): Represents core momentum; zero-line crossings indicate short-term trend changes.
- Dynamic Bands: Volatility-adjusted thresholds signaling overbought or oversold conditions.
- Automated Peak Detection: Identifies momentum extremes signaling potential trend exhaustion.
The KPO provides automated alerts for peak exhaustion and divergence signals, marking bullish and bearish divergences when price and momentum disagree. Trend direction can be confirmed by the histogram’s position relative to zero.
Features include adjustable sensitivity for various asset classes such as Forex, indices, and cryptocurrencies, an integrated alert system (sound, message, visual icons), and modes tailored for scalping or swing trading. The indicator supports analysis based on price bars and outputs reversal and divergence signals to assist in trading decisions.
Avis clients
5 | 100 % | |
4 | 0 % | |
3 | 0 % | |
2 | 0 % | |
1 | 0 % |


![Logo de "[Stellar Strategies] QQE"](https://cdn.ctrader.com/image/webp/e702104a-874c-4b39-97dd-fb34518d1015_27712)