
Descripción
Visualizador Dinámico Dot Momentum %BB para cTrader
Cuantifica la Volatilidad. Visualiza el Momentum. Domina tus Entradas.
Desata el poder de la volatilidad con el Visualizador Dinámico Bollinger Bands %B, un indicador personalizado único para cTrader diseñado para brindarte una visión sin igual de la acción del precio en relación con su envolvente de volatilidad. Más allá de las Bandas de Bollinger tradicionales, este indicador transforma métricas complejas de volatilidad en un flujo intuitivo y codificado por colores de círculos, ayudándote a identificar puntos cruciales de giro del mercado y la fuerza de la tendencia.
¿Qué es Bollinger Bands %B y en qué se diferencia?
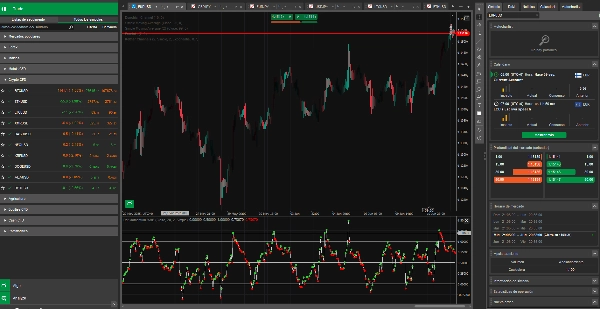
Mientras que las Bandas de Bollinger estándar se superponen directamente en tu gráfico de precios, mostrando soporte/resistencia dinámicos y representando visualmente la volatilidad del mercado mediante su expansión y contracción, el Bollinger Bands %B es un oscilador. Se muestra en un panel separado debajo de tu gráfico principal, proporcionando una medida cuantificable de dónde se encuentra el precio actual dentro de la envolvente de las Bandas de Bollinger.
No muestra el precio directamente; en cambio, revela la posición relativa del precio en una escala de 0 a 1:
- 0.0: El precio está en la Banda de Bollinger Inferior.
- 0.5: El precio está en la Banda de Bollinger Media (la Media Móvil).
- 1.0: El precio está en la Banda de Bollinger Superior.
Beneficios y Contexto de Volatilidad:
Este indicador va más allá de la mera observación. Cuantifica la posición del precio en relación con su volatilidad inherente, permitiéndote:
- Medir la Fuerza de la Tendencia: Un %B persistente por encima de 0.5 sugiere un fuerte momentum alcista, mientras que por debajo de 0.5 indica presión bajista.
- Identificar Reversiones Potenciales: Lecturas extremas (cercanas a 0.0 o 1.0) pueden señalar que el precio está sobreextendido dentro de su rango de volatilidad actual.
- Entender la Volatilidad Contextual: La volatilidad misma (representada por el ancho de las Bandas de Bollinger subyacentes) siempre es contextual al marco temporal que estás visualizando. Una lectura de %B en un gráfico de 1 hora refleja la volatilidad de manera diferente que en un gráfico de 1 día. Nuestro indicador se adapta sin problemas a tu marco temporal elegido, proporcionando información relevante.
Características Técnicas:
- Cálculo Preciso: %B se calcula como: (Precio Actual−Banda Inferior)/(Banda Superior−Banda Inferior)
- Codificación Dinámica de Color (Círculos):
-
- Círculos Verde Lima: Indican que el valor %B está subiendo respecto a la barra anterior, señalando momentum alcista.
- Círculos Rojos: Indican que el valor %B está bajando respecto a la barra anterior, señalando momentum bajista.
- Círculos Plateados: Se muestran cuando el valor %B permanece sin cambios o para el primer punto válido.
- Línea de Trayectoria Sutil: Una línea delgada y gris claro traza sutilmente el camino general del valor %B, proporcionando continuidad visual debajo de los círculos dinámicos.
- Marcadores de Nivel Discretos: Líneas sólidas gris oscuro en 0.0, 0.5 y 1.0 (fácilmente visibles sin dominar la visualización principal) proporcionan puntos de referencia claros para los extremos de volatilidad y la media.
- Personalizable: Ajusta el período de las Bandas de Bollinger, desviaciones estándar y tipo de MA directamente desde la configuración.
Explicación Simplificada: Señales de Sobre-Volatilidad (¡Como un RSI para la Volatilidad!)
Piensa en este indicador como un RSI, pero para sobreextensión de la volatilidad en lugar de simples niveles de sobrecompra/sobreventa del precio.
- Cuando los círculos tocan o bajan de 0.0, significa que el precio está presionando fuertemente contra la parte inferior de su envolvente de volatilidad actual. Esto es como una señal de "volatilidad sobrevendida", sugiriendo que el mercado podría estar sobreextendido a la baja dentro de su contexto actual.
- Cuando los círculos tocan o superan 1.0, significa que el precio está presionando fuertemente contra la parte superior de su envolvente de volatilidad actual. Esto es como una señal de "volatilidad sobrecomprada", sugiriendo que el mercado podría estar sobreextendido al alza dentro de su contexto actual.
Estas lecturas extremas no significan necesariamente "comprar" o "vender" de inmediato, pero son alertas poderosas de que el mercado está en un punto extremo dentro de su rango típico de movimiento para ese marco temporal específico. Esto a menudo precede a una posible reversión a la media o un cambio en el comportamiento de la volatilidad del mercado.
Resumen
Valoraciones de clientes
5 | 0 % | |
4 | 100 % | |
3 | 0 % | |
2 | 0 % | |
1 | 0 % |


