
Sero
مؤشر
105 التنزيلات
الإصدار 1.0، Mar 2026
Windows, Mac
الوصف
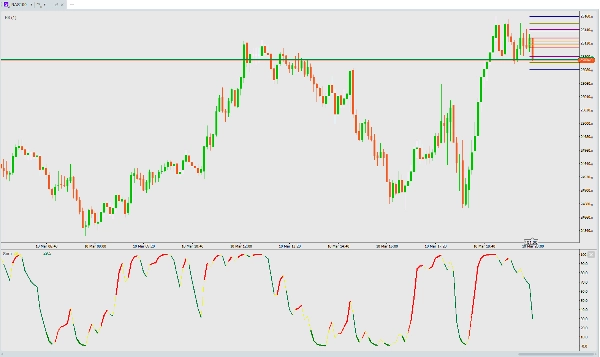
سيرو — مذبذب الزخم
سيرو هو مذبذب زخم يعتمد على العشوائية يعطي إشارات بصرية واضحة وملونة لتغيرات زخم السوق.
كيف يعمل
يقوم سيرو بحساب قيمة عشوائية ملساء من السعر النموذجي (الأعلى+الأدنى+الإغلاق)/3 على مدى 15 شريطًا، ثم يطبق متوسط متحرك أسي سريع بفترة 2 لإنتاج مذبذب استجابة يتراوح بين 0–100.
ما الذي يجب مراقبته
الألوان تحكي القصة:
- الخط الأصفر — قيمة سيرو الأساسية (دائمًا مرئية)
- الخط الأحمر — زخم صعودي (سيرو يرتفع)
- الخط الأحمر السميك — زخم صعودي قوي (ارتفاع + فوق 20 — تأكيد اختراق من منطقة التشبع البيعي)
- الخط الأخضر — زخم هبوطي (سيرو ينخفض)
- الخط الأخضر السميك — هبوط هبوطي قوي (انخفاض + تحت 20 — عميق في منطقة التشبع البيعي)
الإشارات الرئيسية:
- إشارة شراء — تغير اللون من الأخضر إلى الأحمر، خاصة من تحت 20 (انعكاس من التشبع البيعي)
- إشارة بيع — تغير اللون من الأحمر إلى الأخضر، خاصة من فوق 80 (انعكاس من التشبع الشرائي)
- اتجاه قوي — الخطوط السميكة تؤكد قوة الزخم
- الإرهاق — الأخضر السميك تحت 20 = قد يكون البائعون على وشك النفاد، راقب الانعكاس
أفضل الممارسات
- يعمل على أي إطار زمني و أي أداة
- الدمج مع حركة السعر أو مستويات الدعم/المقاومة للتأكيد
- الانتقالات اللونية بالقرب من الأطراف (0 أو 100) هي الإشارات ذات أعلى احتمالية
- لا حاجة لإعدادات — مُحسّن وجاهز للاستخدام مباشرة
الملخص
ملخص الذكاء الاصطناعي
Sero is a stochastic-based momentum oscillator designed to identify market momentum shifts through clear, color-coded visual signals. It calculates a smoothed stochastic value from the Typical Price [(High + Low + Close) / 3] over a 15-bar range, then applies a fast 2-period exponential moving average (EMA) to generate a responsive oscillator ranging from 0 to 100.
The indicator displays multiple colored lines to represent momentum states:
- Yellow line: base Sero value (always visible)
- Red line: bullish momentum (rising oscillator)
- Thick red line: strong bullish momentum (rising and above 20, indicating breakout from oversold)
- Green line: bearish momentum (falling oscillator)
- Thick green line: strong bearish momentum (falling and below 20, indicating deep oversold conditions)
Key signals include buy signals when the color flips from green to red, especially below 20 (oversold reversal), and sell signals when it flips from red to green, especially above 80 (overbought reversal). Thick lines confirm strong momentum trends, while thick green lines below 20 may indicate exhaustion of selling pressure and potential reversal.
Sero works on any timeframe and instrument without requiring user settings, and it is recommended to combine it with price action or support/resistance levels for confirmation. Color transitions near extremes (0 or 100) provide the highest-probability signals.
ملف تعريف المؤشر
تقييمات العملاء
0.0
التقييمات: 0
تقييمات العملاء
لا توجد تقييمات لهذا المنتج حتى الآن. هل جرَّبته بالفعل؟ كن أول من يخبر الآخرين!
مناقشة
الأسئلة الشائعة
BTCUSD
Forex
Signal
Indices
EURUSD
Commodities
GBPUSD
NZDUSD
Crypto
Stocks
XAUUSD
NAS100
USDJPY
يتم توفير المنتجات المتاحة من خلال cTrader Store، بما في ذلك روبوتات التداول والمؤشرات والإضافات، من قبل مطوري الطرف الثالث وإتاحتها لأغراض الوصول المعلوماتي والفني فقط. cTrader Store ليس وسيطًا ولا يقدم نصائح استثمارية أو توصيات شخصية أو أي ضمان للأداء المستقبلي.
المزيد من هذا المؤلف


السعر
منذ 10/03/2026
105
التثبيتات المجانية