
الوصف
مؤشر القمم والقيعان والانكسار الهيكلي
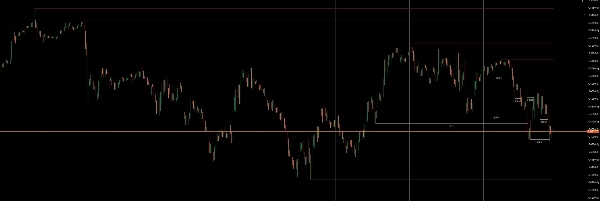
هيكل السوق النظيف يكتشف تلقائيًا القمم والقيعان ويرسم مستويات الدعم والمقاومة الديناميكية بناءً على هيكل المحور المؤكد.
تمتد المستويات إلى الأمام في الزمن حتى يكسر السعر هذه المستويات. عندما يحدث انكسار الهيكل (BOS)، يتم تحويل المستوى إلى خط تاريخي مع تسمية الانكسار، مما يسمح للمتداولين بالتعرف بسرعة على التحولات الهيكلية ومسح السيولة.
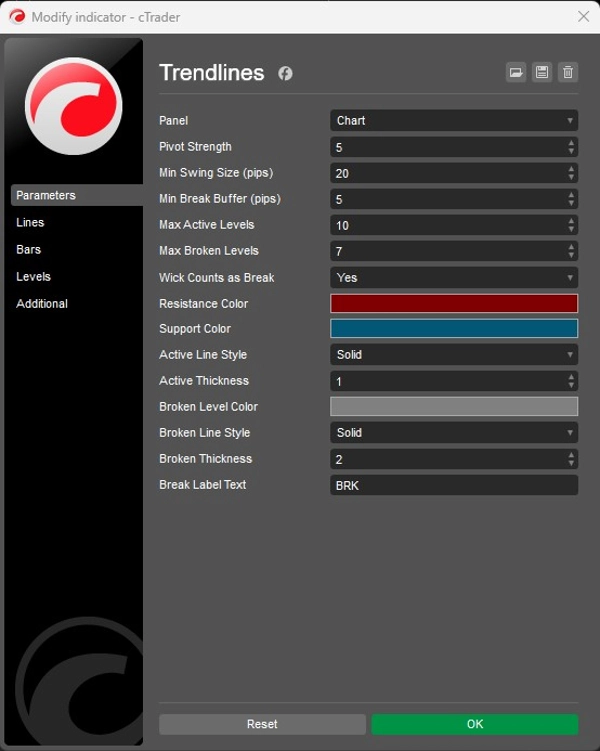
يشمل المؤشر مرشحات مثل الحد الأدنى لحجم التأرجح و فواصل الانكسار لتجاهل المحاور غير المهمة والتركيز فقط على هيكل السوق ذي المعنى.
تستخدم المستويات النشطة والمكسورة أنماطًا بصرية منفصلة، بينما تحافظ الحدود المدمجة على نظافة الرسم البياني من خلال التحكم في عدد المستويات التي تبقى مرئية.
نظرًا لأن المحاور يتم تأكيدها فقط بعد إغلاق العدد المطلوب من الشموع، فإن منطق الهيكل مستقر وغير معيد للرسم.
الميزات الرئيسية
• الكشف التلقائي عن القمم والقيعان
• مستويات الدعم والمقاومة الديناميكية
• العلامة التلقائية لـ انكسار الهيكل (BOS)
• مرشح الحد الأدنى للتأرجح لإزالة الضوضاء
• الكشف الاختياري عن كسر الظل أو الإغلاق
• تنسيق منفصل لـ المستويات النشطة مقابل المكسورة
• حدود لـ المستويات النشطة والتاريخية للحفاظ على نظافة الرسوم البيانية
• منطق المحاور غير المعيد للرسم
مثالي لـ
• تداول حركة السعر
• استراتيجيات الدعم والمقاومة
• التداول القائم على السيولة
• أنظمة انكسار الهيكل
• التداول السريع، التداول اليومي، وتداول التأرجح
الملخص
تقييمات العملاء
5 | 67 % | |
4 | 33 % | |
3 | 0 % | |
2 | 0 % | |
1 | 0 % |


![شعار "[Stellar Strategies] Smart ADX"](https://cdn.ctrader.com/image/webp/af13b084-b6f6-41db-b7bc-c7e688b57b05_36929)


