

Descripción
Distribución Profunda del Estado de Ánimo (DMD) 📊🧠
Resumen
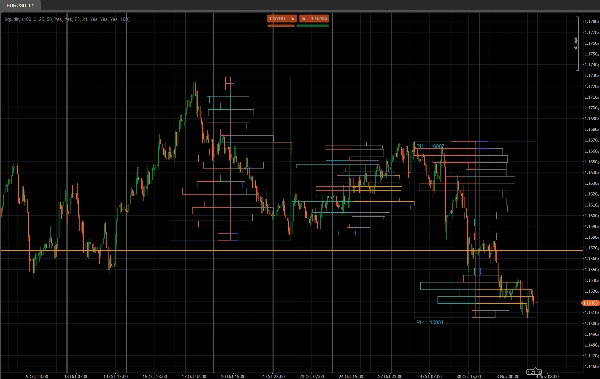
Distribución Profunda del Estado de Ánimo (DMD) es una herramienta segmentada de perfil de volumen y sentimiento que analiza la acción del precio en bloques fijos de barras y muestra:
- Dónde se concentra la actividad comercial ⚖️
- Dónde la liquidez es escasa o reactiva (posibles zonas de S&D / liquidez) 💧
- Qué lado está dominando en cada área de precio (compradores vs vendedores) 🐂🐻
En lugar de un perfil deslizante único, DMD divide el gráfico en bloques repetitivos de X barras y construye un mapa separado de liquidez y sentimiento para cada bloque.
Esto facilita comparar visualmente cómo la distribución del volumen y el estado de ánimo del mercado cambian de un segmento a otro.
Cómo funciona 🧩
Para cada bloque de Barras en Perfil velas:
- El indicador encuentra el precio más alto y más bajo de ese bloque.
- El rango de precios se divide en
Número de Filasbins de precio verticales. - Para cada vela en el bloque:
-
- El volumen de ticks se distribuye a través de cada bin de precio tocado por el rango de la vela.
- Se acumulan dos volúmenes para cada fila:
-
- Volumen total en esa fila de precio
- Volumen alcista (solo barras donde Cierre > Apertura)
- A partir de estos, DMD construye:
-
- Perfil de liquidez (lado derecho)
-
- La longitud de la fila ∝ volumen relativo frente al volumen máximo de fila del bloque
- El color muestra nodos negociados altos / promedio / bajos
- Perfil de sentimiento (lado izquierdo)
-
- Sentimiento por fila =
2 × VolumenAlcista − VolumenTotal - Positivo = dominado por compradores (estado de ánimo alcista)
- Negativo = dominado por vendedores (estado de ánimo bajista)
- Sentimiento por fila =
- El proceso se repite para los últimos N bloques, para que puedas comparar varios segmentos lado a lado.
Lado derecho – Perfil de liquidez (Volumen) 📊
Las barras del lado derecho muestran cuánta actividad comercial (volumen) ocurrió en cada nivel de precio dentro de ese bloque, sin importar quién compraba o vendía.
- Nodos de alto volumen (HVN) – por ejemplo, barras naranjas
-
- Una fila cuyo volumen es ≥
Porcentaje Umbral de Comercio Altodel volumen máximo de fila en el bloque - Representan áreas de valor, comercio intenso, zonas de consolidación.
- Una fila cuyo volumen es ≥
- Nodos de bajo volumen (LVN) – por ejemplo, barras azules
-
- Una fila cuyo volumen es ≤
Porcentaje Umbral de Comercio Bajodel volumen máximo de fila - Representan zonas de liquidez escasa, posibles áreas de rechazo o movimientos rápidos.
- Una fila cuyo volumen es ≤
- Nodos de volumen promedio – por ejemplo, barras grises
-
- Todo lo que está entre los umbrales alto y bajo
- Niveles “normales” de comercio, no extremos.
🧠 Longitud de la barra (lado derecho)
→ Proporcional al volumen total negociado en esa fila de precio comparado con el volumen máximo del bloque.
Más volumen → barra más larga.
Parámetros clave:
Porcentaje Umbral de Comercio AltoPorcentaje Umbral de Comercio Bajo
Lado izquierdo – Perfil de Sentimiento (Estado de Ánimo del Mercado) 🧠📉📈
Las barras del lado izquierdo muestran el sentimiento / dominio en cada nivel de precio: si los compradores o vendedores fueron más fuertes en esa fila.
Para cada fila:
Sentimiento=2×VolumenAlcista−VolumenTotal\text{Sentiment} = 2 \times \text{BullishVolume} - \text{TotalVolume}Sentiment=2×BullishVolume−TotalVolume
- Barra alcista (compradores en control) – por ejemplo, barras teal/verde
-
- Sentimiento > 0
- Más volumen provino de velas alcistas (Cierre > Apertura) en ese precio.
- Indica dominancia del lado comprador en esa fila de precio.
- Barra bajista (vendedores en control) – por ejemplo, barras rojas
-
- Sentimiento < 0
- Más volumen provino de velas bajistas (Cierre < Apertura).
- Indica dominancia del lado vendedor.
🧠 Longitud de la barra (lado izquierdo)
→ Proporcional al valor absoluto del sentimiento (|Sentimiento|) relativo a la fila más fuerte en el bloque.
Dominancia más fuerte (gran desequilibrio entre compradores y vendedores) → barra más larga.
Parámetro clave:
Mostrar Perfil de Sentimiento(encendido/apagado)
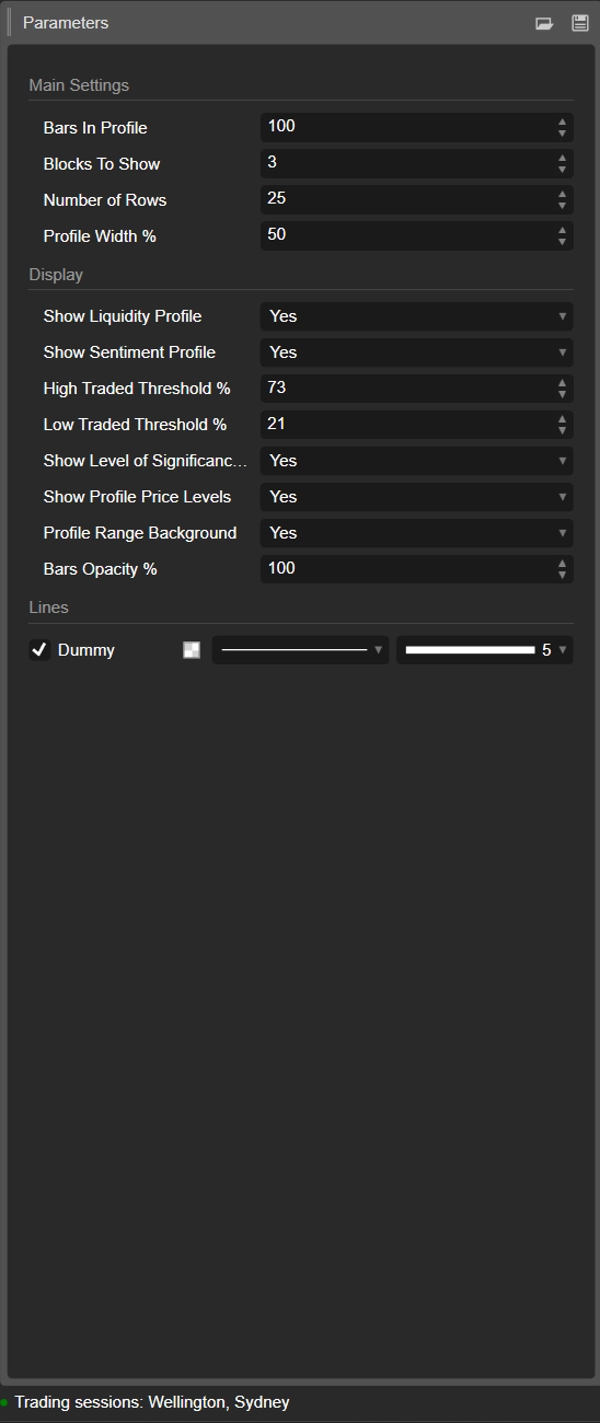
Detalles del Parámetro ⚙️
1. Barras en Perfil
Grupo: Configuraciones Principales
Número de velas contenidas en cada bloque.
- Ejemplo:
Barras en Perfil = 100 -
- Bloque 0 → últimas 100 barras
- Bloque 1 → 100 barras anteriores
- Bloque 2 → 100 anteriores, y así sucesivamente.
Úsalo para ajustar bloques a:
- aproximar sesiones,
- tu rango típico de swing / intradía,
- o cualquier ventana personalizada que quieras analizar.
Valor más pequeño = más reactivo, más granular.
Valor más grande = estructura más suave, más “macro”.
2. Bloques a Mostrar
Grupo: Configuraciones Principales
Cuántos bloques consecutivos se dibujarán en el gráfico.
1→ solo el bloque más reciente2–3→ muy práctico para comparación sin desorden- Valores más altos → más historia, pero más objetos en el gráfico
Los bloques más antiguos más allá de este valor se limpian automáticamente para mantener la estabilidad.
3. Número de Filas
Grupo: Configuraciones Principales
Resolución vertical del perfil de cada bloque.
El rango de precios del bloque se divide en esta cantidad de filas (niveles de precio).
- Valor más alto → más detalle, filas más delgadas, más rectángulos
- Valor más bajo → estructura más suave, más fácil de leer
Rangos típicos:
15–25para uso intradía normal30–40+solo si quieres resolución muy fina y tu plataforma es lo suficientemente potente
4. Ancho del Perfil %
Grupo: Configuraciones Principales
Controla qué tan lejos se extiende el perfil horizontalmente desde el centro del bloque, como porcentaje del ancho del bloque.
- Afecta tanto a la liquidez (lado derecho) como al sentimiento (lado izquierdo).
- Porcentaje más alto → los perfiles se extienden más hacia las barras circundantes
- Porcentaje más bajo → perfil compacto cerca del centro del bloque
Buenos valores iniciales: 35–50%.
5. Mostrar Perfil de Liquidez
Grupo: Visualización
Activa o desactiva la distribución de volumen (perfil de liquidez) (lado derecho de cada bloque).
- Activado ✅
-
- La longitud de cada fila refleja el volumen negociado relativo en ese nivel de precio.
- El color codifica nodos negociados altos / promedio / bajos.
- Desactivado ❌
-
- Solo se muestra el sentimiento (si está habilitado), no hay barras de volumen a la derecha.
6. Mostrar Perfil de Sentimiento
Grupo: Visualización
Activa o desactiva el perfil de sentimiento (lado izquierdo de cada bloque).
- Activado ✅
-
- Las filas se colorean:
-
- Alcista (compradores dominantes) – por ejemplo, aqua/verde
- Bajista (vendedores dominantes) – por ejemplo, rojo
- La longitud de la fila refleja la fuerza del dominio.
- Desactivado ❌
-
- Solo se muestra la distribución pura de liquidez/volumen.
Usa esto si quieres ver no solo dónde se negoció volumen, sino quién estuvo más activo en esos niveles.
7. Porcentaje Umbral de Comercio Alto
Grupo: Visualización
Define el límite para nodos de alto volumen (HVNs) dentro de cada bloque.
- Expresado como % del volumen máximo de fila del bloque.
- Ejemplo: Volumen máximo de fila = 10,000; umbral = 70% → filas ≥ 7,000 cuentan como HVNs.
Los HVNs a menudo marcan:
- áreas de valor,
- zonas de consolidación,
- áreas de posicionamiento fuerte / valor justo.
8. Porcentaje Umbral de Comercio Bajo
Grupo: Visualización
Define el límite para nodos de bajo volumen (LVNs) en relación con el volumen máximo del bloque.
- Las filas con volumen por debajo de este porcentaje se tratan como zonas de baja actividad.
- Estas pueden actuar como:
-
- bolsillos de liquidez escasa,
- niveles potenciales de rechazo,
- o áreas donde el precio tiende a moverse rápidamente.
Uso típico: 15–30%.
9. Mostrar Nivel de Significancia (POC)
Grupo: Visualización
Muestra u oculta el Punto de Control (POC) para el bloque más reciente.
- POC = fila de precio con mayor volumen negociado en ese bloque.
- Se muestra como una línea horizontal en ese precio. 🎯
Útil como:
- referencia para reversión a la media,
- ancla de “precio justo” intradía,
- o nivel clave para gestión de operaciones.
10. Mostrar Niveles de Precio del Perfil
Grupo: Visualización
Muestra etiquetas de texto para:
- Máximo del Perfil (PH) – precio más alto alcanzado en el bloque
- Mínimo del Perfil (PL) – precio más bajo alcanzado en el bloque
Las etiquetas se muestran para el bloque más reciente e incluyen los valores exactos de precio.
Ideal para:
- leer rápidamente el rango actual,
- establecer stops/objetivos alrededor de PH/PL,
- contexto para rupturas o rotaciones.
11. Fondo del Rango del Perfil
Grupo: Visualización
Dibuja un rectángulo de fondo semitransparente que cubre el:
- rango de tiempo (barra inicial a final)
- rango de precio (mínimo a máximo)
Esto separa visualmente los bloques y hace que cada rango destaque.
Desactívalo si prefieres un visual más limpio y minimalista.
12. Opacidad de las Barras %
Grupo: Visualización
Controla qué tan sólidos o sutiles son los rectángulos (tanto barras de liquidez como de sentimiento).
- 20–40% → muy ligero, estilo de fondo
- 50–70% → visibilidad equilibrada, velas aún fáciles de ver
- 80–100% → bloques fuertes, casi totalmente opacos
Internamente este valor se convierte en un canal alfa (0–255) para los colores de las barras.
Plantilla inicial sugerida ⭐
Para índices / futuros intradía (M5–M15):
- Barras en Perfil: 80–120
- Bloques a Mostrar: 2–3
- Número de Filas: ~20
- Ancho del Perfil %: 35–45
- Mostrar Perfil de Liquidez: true
- Mostrar Perfil de Sentimiento: true
- Opacidad de las Barras %: 50–65
Resumen
Key features include:
- Liquidity Profile (right side): Displays trading volume concentration at each price level within a block, highlighting high-volume nodes (HVNs), low-volume nodes (LVNs), and average-volume nodes. Bar length corresponds to relative traded volume, and colors indicate volume intensity.
- Sentiment Profile (left side): Shows buyer vs. seller dominance per price level, calculated as twice the bullish volume minus total volume. Positive values indicate buy-side control; negative values indicate sell-side control. Bar length reflects the strength of dominance, with color coding for bullish (green/teal) and bearish (red) sentiment.
- Configurable parameters: number of bars per profile block, number of blocks displayed, vertical resolution (rows), profile width, opacity, and thresholds for defining HVNs and LVNs.
- Additional display options: Point of Control (POC) line for highest volume price in the latest block, profile high/low price labels, and background shading for block ranges.
DMD supports analysis across various markets including indices, commodities, forex, and cryptocurrencies, facilitating identification of trading activity concentration, liquidity zones, and market sentiment shifts within customizable timeframes.
Valoraciones de clientes
5 | 0 % | |
4 | 100 % | |
3 | 0 % | |
2 | 0 % | |
1 | 0 % |


