
Superior Trading Sessions Indicator cTrader
Indicador
1 compras
Versión 1.0, Jun 2026
Windows, Mac
Descripción
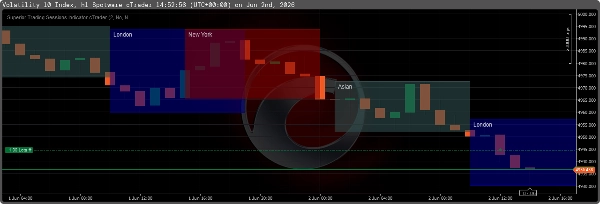
El Indicador de Sesiones de Trading Superior es una herramienta de mapeo puramente técnica construida de forma nativa para cTrader. Calcula y visualiza automáticamente las principales sesiones de trading globales (Asia, Londres, Nueva York, Frankfurt) junto con elementos estructurales de Conceptos de Dinero Inteligente (SMC). Está diseñado para rastrear piscinas de liquidez y objetivos estructurales sin saturar la acción del precio.
Visualizaciones Principales
- Rectángulos de Sesión: Mapea las 4 principales sesiones de trading y 4 "Killzones" de alta volatilidad específicas con transparencia ajustable y bordes sólidos nítidos.
- Máximo/Mínimo del Día Anterior (PDH/PDL): Traza automáticamente los precios máximos y mínimos de ayer como objetivos estructurales de liquidez para el día actual en vivo.
- Proyecciones del Rango Asiático: Extiende líneas horizontales desde el Máximo y Mínimo Asiático hacia adelante por 16 horas para ayudar a identificar barridos de liquidez durante la superposición de Londres y Nueva York.
- Equilibrio de Sesión: Dibuja una línea media al 50% (equilibrio) a través de las sesiones activas para determinar objetivamente las regiones de Precio Premium vs. Descuento.
- Datos en Tiempo Real: Muestra el tamaño en pips en tiempo real de la sesión activa junto con etiquetas exactas de Precio Máximo/Mínimo en las esquinas de la caja de la sesión.
- Reducción de Saturación: Incluye una opción para ocultar completamente todas las cajas de sesiones históricas, dejando solo la sesión activa en el gráfico.
Parámetros de Entrada Explicados
Configuración de Zona Horaria
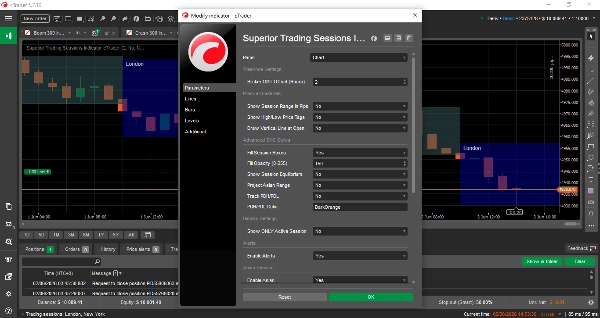
- Desplazamiento GMT del Broker: (Entero) Establezca esto al desplazamiento UTC/GMT de su broker. Esto asegura que las horas estándar de sesión se alineen perfectamente con la hora del servidor de su broker.
Funciones Premium
- Mostrar Rango de Sesión en Pips: (Verdadero/Falso) Muestra la altura total de la sesión en pips junto a la etiqueta del nombre de la sesión.
- Mostrar Etiquetas de Precio Máximo/Mínimo: (Verdadero/Falso) Imprime el nivel de precio exacto en las esquinas superior e inferior derecha de la caja de la sesión.
- Dibujar Línea Vertical en la Apertura: (Verdadero/Falso) Dibuja una línea vertical punteada exactamente en la vela de apertura de la sesión.
Estilos Avanzados de SMC
- Rellenar Cajas de Sesión: (Verdadero/Falso) Si es Verdadero, el rectángulo tiene un fondo sombreado. Si es Falso, el rectángulo está hueco (dibuja solo el marco del borde).
- Opacidad de Relleno (0-255): Controla la transparencia del relleno de la sesión. Valores bajos (por ejemplo, 80) mantienen visibles las velas; valores altos crean un fondo más oscuro y rico.
- Mostrar Equilibrio de Sesión: (Verdadero/Falso) Dibuja una línea punteada exactamente en el nivel de retroceso del 50% de la sesión.
- Proyectar Rango Asiático: (Verdadero/Falso) Proyecta líneas de tendencia horizontales desde el Máximo y Mínimo Asiático a lo largo del resto del día.
- Rastrear PDH/PDL: (Verdadero/Falso) Dibuja líneas horizontales sólidas marcando el máximo y mínimo extremo del día anterior.
- Color PDH/PDL: Define el color usado para las líneas de liquidez diarias.
Configuración de Visualización
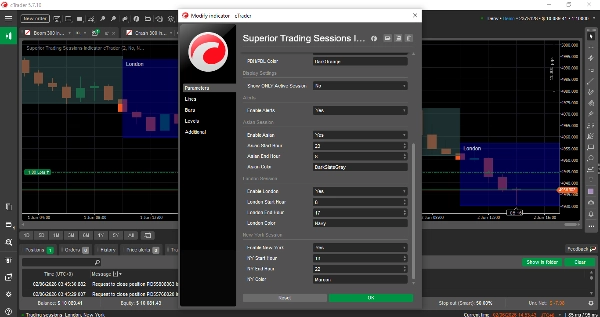
- Mostrar SOLO Sesión Activa: (Verdadero/Falso) Si es Verdadero, el indicador elimina todos los dibujos históricos y solo muestra la sesión que está ocurriendo actualmente.
Alertas y Notificaciones
- Habilitar Alertas: (Verdadero/Falso) Reproduce el sonido nativo de timbre de cTrader en el segundo exacto en que comienza una nueva sesión.
Horarios de Sesión
- Habilitar [Sesión]: Activa o desactiva la visibilidad de la sesión principal.
- Hora de Inicio/Fin de [Sesión]: Las horas de inicio y fin GMT para la sesión principal.
- Color de [Sesión]: El color específico aplicado a la caja, texto y líneas de esa sesión.
Resumen
Resumen de IA
The Superior Trading Sessions Indicator for cTrader is a technical charting tool that automatically maps major global trading sessions—Asian, London, New York, and Frankfurt—directly on your charts. It highlights key market periods known as "Killzones" with adjustable transparency and clear borders. The indicator plots previous day’s high and low prices as structural liquidity targets and extends Asian session range lines forward to assist in identifying liquidity sweeps during overlapping sessions.
It includes a session equilibrium line marking the 50% midpoint to help distinguish premium versus discount price zones. Real-time session pip ranges and exact high/low price labels are displayed for active sessions. Users can reduce chart clutter by showing only the current session’s data.
Configurable input parameters allow adjustment of broker GMT offset, session start/end times, colors, and display options such as filled or hollow session boxes, vertical lines at session open, and alert sounds at session start. Advanced Smart Money Concepts (SMC) features support tracking of liquidity pools and structural levels including previous day highs/lows and Asian range projections.
This indicator is designed to provide clear, structured visualization of key trading sessions and liquidity targets without obscuring price action, aiding traders in market timing and structural analysis.
Perfil del indicador
Categoría del indicador
Estructura del mercado (SMC)
Tipo de resultado
Visualización
Requisitos de datos
Datos de tic
Únicamente barras
Señales admitidas
Rango en la apertura de la sesión
Valoraciones de clientes
0.0
Valoraciones: 0
Valoraciones de clientes
Este producto todavía no se ha valorado. ¿Ya lo ha probado? Sea el primero en informar a otros.
Conversación
Preguntas frecuentes
Fibonacci
Premium/Discount
Key Levels
BOS
Liquidity Sweep
Support & Resistance
Los productos disponibles a través de cTrader Store, incluidos bots, indicadores y plugins para operar, son proporcionados por desarrolladores de terceros y están disponibles únicamente con fines informativos y de acceso técnico. cTrader Store no es un bróker, por lo que no proporciona asesoramiento de inversión, recomendaciones personales ni ninguna garantía de rentabilidad futura.
Más de este autor


Precio
26
Ventas