
Descripción
VolumeProfileSuite es un indicador avanzado y flexible de Perfil de Volumen para cTrader.
Su propósito principal es analizar la distribución del volumen (es decir, dónde ocurrió la actividad comercial) en diferentes niveles de precio para identificar áreas de "valor" (alto volumen) y "rechazo" (bajo volumen). Esto te ayuda a encontrar los niveles de soporte y resistencia más significativos basados en la actividad real del mercado.
Su característica única es que combina dos modos de análisis poderosos en una sola herramienta, seleccionable mediante el parámetro Profile Mode:
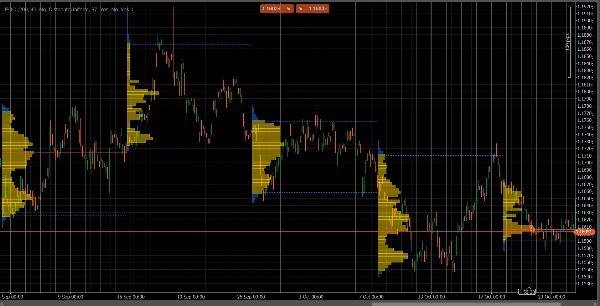
FixedRangeMode: Perfecto para el análisis macro. Te permite analizar un solo bloque grande de tu elección (como las últimas 1000 barras o un rango de fechas específico, por ejemplo, "toda la semana pasada"). Es ideal para encontrar niveles principales de soporte/resistencia a largo plazo.PeriodicMode: Perfecto para el análisis micro y conductual. Dibuja automáticamente un nuevo perfil cada "N" barras (por ejemplo, cada 100 barras). Esto te permite ver cómo evolucionan el POC y el Área de Valor con el tiempo y estudiar los patrones repetitivos del mercado.- Guía de Parámetros (Inglés)
Aquí está la guía actualizada para tu nuevo indicador unificado VolumeProfileSuite. Esta guía es crucial ya que explica qué parámetros usar (y cuáles ignorar) según el modo seleccionado.
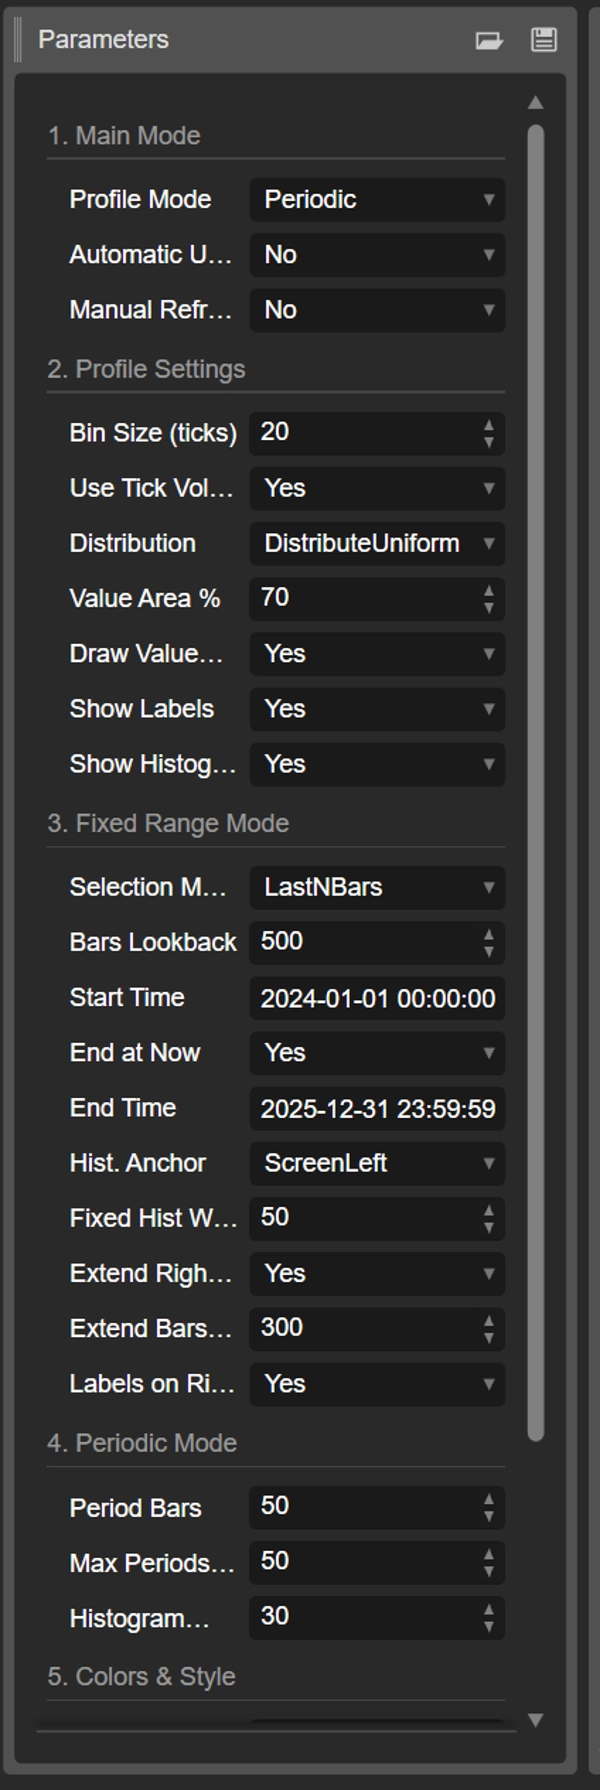
Grupo 1: Modo Principal
- Profile Mode: Este es el parámetro más importante y actúa como el interruptor maestro.
-
FixedRange: Activa el modo "bloque único". El indicador analizará solo un intervalo especificado por ti (usando la configuración del Grupo 3).Periodic: Activa el modo "cíclico". El indicador analizará automáticamente todo el gráfico en bloques (basado en la configuración del Grupo 4).
IMPORTANTE: Cuando estés en modo
FixedRange, debes ignorar todos los parámetros en "Grupo 4: Modo Periódico". Cuando estés en modoPeriodic, debes ignorar todos los parámetros en "Grupo 3: Modo Rango Fijo".
Grupo 2: Configuración del Perfil
Estos parámetros son comunes y aplican a ambos modos (FixedRange y Periodic).
- Bin Size (ticks): Controla la "resolución" vertical del perfil. Un valor bajo (por ejemplo,
1) crea muchas filas de precio delgadas (muy detallado). Un valor alto (por ejemplo,10) agrupa los precios en filas más gruesas (menos detallado, "más suave"). - Use Tick Volume: Si
true(recomendado), el perfil usa el volumen real de ticks, que es muy preciso. Sifalse, simplemente cuenta "1" por cada barra. - Distribution: Define cómo se distribuye el volumen de una barra.
-
DistributeUniform(predeterminado): "Distribuye" el volumen de la barra a lo largo de todos los niveles de precio que tocó, desde su mínimo hasta su máximo.CloseOnly: Asigna todo el volumen de la barra solo a su precio de cierre.
- Value Area %: Establece el porcentaje de volumen que constituye el "Área de Valor" (el área de mayor actividad comercial). Un valor de
70(70%) es el estándar del mercado. - Draw Value Area (VAH/VAL): Si
true, dibuja las líneas horizontales para el Valor Alto del Área (VAH) y el Valor Bajo del Área (VAL). - Show Labels: Si
true, muestra etiquetas de texto ("POC", "VAH", "VAL"). (Cuidado: en modoPeriodic, esto puede saturar el gráfico). - Show Histogram: Si
true, dibuja el histograma de volumen (las barras horizontales).
Grupo 3: Modo Rango Fijo
⚠️ Usa estos parámetros SOLO si "Profile Mode" está configurado en FixedRange.
- Selection Mode: Elige cómo definir tu bloque único.
-
DateRange: Usa una fecha/hora de inicio y fin específica.LastNBars: Usa las últimas N barras.
- Bars Lookback: (Solo para
LastNBars) Cuántas barras hacia atrás analizar (por ejemplo,500). - Start Time / End at Now / End Time: (Solo para
DateRange) Define el inicio y fin de tu intervalo. - Hist. Anchor: (Solo para
FixedRange) Define dónde anclar el histograma. -
DateRangeStart: Al inicio de tu intervalo (puede estar fuera de pantalla).ScreenLeft: Al borde izquierdo de la ventana visible.ScreenRight: Al borde derecho de la ventana visible (en el espacio vacío).
- Fixed Hist Width (bars): El ancho del histograma (en barras) para el modo
FixedRange. - Extend Right Only: Si
true, las líneas POC/VAH/VAL se extienden hacia el futuro. - Extend Bars: (Solo si
Extend Right Onlyestrue) Cuántas barras extender las líneas. - Labels on Right: Si
true, coloca etiquetas de precio al final derecho de las líneas extendidas.
Grupo 4: Modo Periódico
⚠️ Usa estos parámetros SOLO si "Profile Mode" está configurado en Periodic.
- Period Bars: Este es el parámetro clave para este modo. Define cuántas barras incluir en cada bloque cíclico (por ejemplo,
100). - Max Periods to Draw: 🌟 ¡PARÁMETRO DE SEGURIDAD! Esto limita el número de perfiles cíclicos dibujados para evitar que cTrader se bloquee.
50significa que solo dibujará los 50 perfiles más recientes, incluso si el historial tiene más. ¡No configures esto demasiado alto (por ejemplo, > 200) o cTrader podría congelarse! - Histogram Width (bars): El ancho del histograma (en barras) para cada bloque cíclico.
Grupo 5: Colores y Estilo
Estos parámetros son comunes y aplican a ambos modos.
- POC Color: El color de la línea de Punto de Control.
- VA Color: El color de las líneas VAH y VAL.
- Line Thickness: El grosor de las líneas POC, VAH y VAL.
- VA Histogram Color: El color de las barras del histograma dentro del Área de Valor (predeterminado: Amarillo).
- Outside Hist Color: El color de las barras del histograma fuera del Área de Valor (predeterminado: Azul).
- Histogram Opacity %: La transparencia (opacidad) de todo el histograma.
Resumen
The indicator offers two main analysis modes selectable via the Profile Mode parameter:
1. FixedRange Mode: Analyzes a single user-defined interval, such as a specific date range or the last N bars, suitable for macro-level, long-term support and resistance identification.
2. Periodic Mode: Automatically segments the chart into consecutive blocks of N bars, drawing a new profile for each. This mode supports micro-level and behavioral analysis by tracking how the Point of Control (POC) and Value Area evolve over time.
Common configurable settings include bin size (price resolution), volume type (tick volume or bar count), volume distribution method, value area percentage, and visual options such as histogram display and labeling. FixedRange and Periodic modes have distinct parameter groups to tailor their respective analyses.
Color and style options allow customization of POC, Value Area lines, and histogram appearance. The tool supports various markets including Forex, indices, commodities, stocks, and cryptocurrencies, as indicated by its relevant tags.
Valoraciones de clientes
5 | 50 % | |
4 | 50 % | |
3 | 0 % | |
2 | 0 % | |
1 | 0 % |


