
Descripción
Presentación del Mercado (corta)
Delta de Volumen y CVD — Lea el flujo agresivo en tiempo real. Reinicios flexibles (Día/Semana/Mes), suavizado EMA opcional, y delta acumulativa que no se repinta. Perfecto para confirmar rupturas y detectar divergencias.
Delta de Volumen y CVD — Guía de Revisión y Parámetros
Lema: Mida el desequilibrio compra/venta (Delta) y su flujo acumulativo (CVD) con reinicios flexibles. No se repinta.
Resumen
Delta de Volumen y CVD para cTrader calcula, por barra, el Delta (compra agresiva vs venta) y el CVD (Delta de Volumen Acumulativo). Le ayuda a leer la presión del flujo de órdenes, confirmar rupturas y detectar divergencias contra el precio.
Nota: El indicador usa TickVolume (estándar de cTrader) como proxy de volumen.
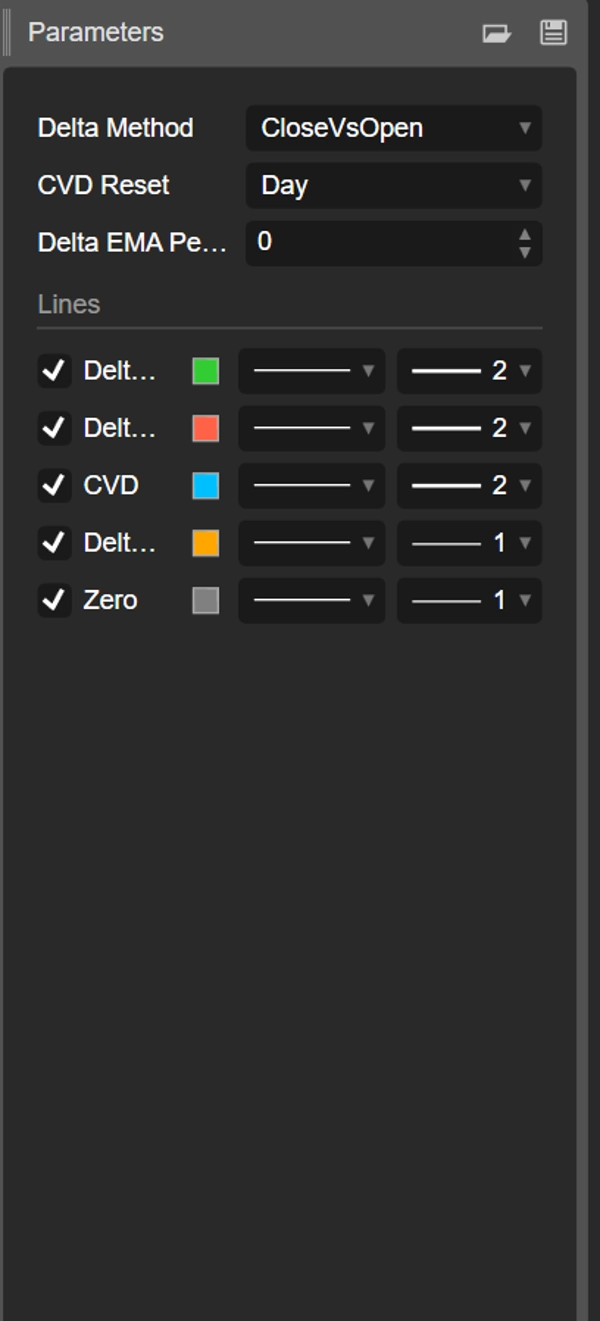
Parámetros (detallados)
Método Delta
Elija cómo se estima el flujo direccional de la barra:
- CloseVsPrevClose
Delta = ±TickVolume dependiendo de Close[t] vs Close[t-1].
Ventajas: muy sensible; ideal para cambios de régimen intradía. - CloseVsOpen
Delta = ±TickVolume dependiendo de Close vs Open de la misma barra.
Ventajas: resalta barras direccionales; reduce ruido entre barras. - Multiplicador de Flujo de Dinero (MFM)
MFM = ((Close−Low) − (High−Close)) / (High−Low)en [−1, +1]
Delta = MFM × TickVolume
Ventajas: ponderación intra-barra; suave/robusto cuando los rangos son amplios.
Reinicio de CVD
Controla cuándo se reinicia el contador acumulativo:
- Ninguno: continuo desde el inicio del gráfico.
- Día: reinicia en cada nuevo día (sesgo intradía).
- Semana: reinicia en cada nueva semana (swing).
- Mes: reinicia en cada nuevo mes (sesgo de marco temporal superior).
Periodo EMA Delta (0 = desactivado)
- Aplica una EMA al Delta para suavizar el histograma y revelar cambios de régimen.
- Sugerencias: 5–9 para scalping, 10–21 intradía, 21–34 swing.
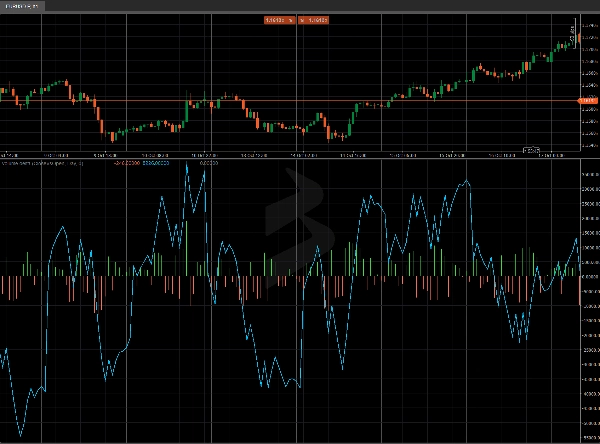
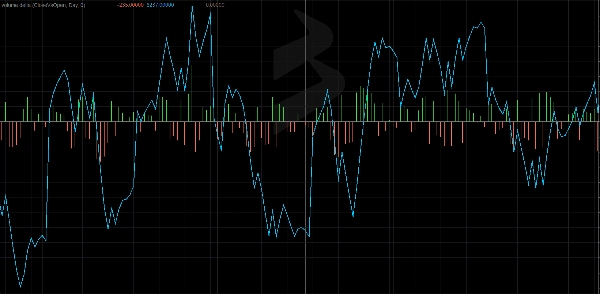
Salidas / Buffers
- Delta Alcista (histograma verde): porción positiva de Delta.
- Delta Bajista (histograma rojo): porción negativa de Delta.
- CVD (línea aqua): suma acumulativa de Delta con el reinicio elegido.
- EMA Delta (línea naranja, opcional): Delta suavizado.
- Cero (línea gris): línea base para comparación rápida.
Cómo Leerlo
- Delta > 0 → dominio agresivo de compradores en la barra.
- Delta < 0 → dominio agresivo de vendedores en la barra.
- CVD en aumento → acumulación; CVD en descenso → distribución.
- Divergencias
-
- El precio hace máximos más altos mientras que CVD no lo confirma → posible agotamiento de la presión compradora.
- El precio hace mínimos más bajos mientras que CVD no lo confirma → posible agotamiento de la presión vendedora.
Guías Prácticas
- Confirmación de ruptura: prefiera rupturas largas cuando CVD se acelera y EMA Delta se vuelve positiva.
- Reversión de extensiones: busque divergencias precio vs CVD en niveles clave (VWAP/VWAP Anclado, S/R).
- Sesgo de sesión: con Reinicio CVD = Día, lea la dirección intradía dominante.
Inicio Rápido
- Adjunte el indicador.
- Comience con Método Delta = MFM, Reinicio CVD = Día, EMA = 10 (intradía).
- En gráficos ruidosos, aumente la EMA o cambie a CloseVsOpen.
- Busque confluencia con VWAP Anclado, S/R estático/dinámico, o patrones de acción del precio.
Rendimiento y Compatibilidad
- APIs modernas (
Bars.*,LineColor). - Cálculos que no se repintan.
- Funciona en cualquier símbolo y marco temporal.
Resumen
The indicator supports three Delta calculation methods: CloseVsPrevClose (responsive for intraday shifts), CloseVsOpen (reduces noise by focusing on directional bars), and Money Flow Multiplier (MFM) which weights intra-bar volume for smoother results. An optional Exponential Moving Average (EMA) smoothing can be applied to Delta to highlight regime changes.
Outputs include separate histograms for positive and negative Delta, the CVD line, an optional Delta EMA line, and a zero baseline for reference. Traders can use the indicator to confirm breakouts, identify divergences between price and volume flow, and assess order-flow pressure. It works on any symbol and timeframe, supporting markets such as Forex, indices, commodities, stocks, and cryptocurrencies.


