Descripción
Líneas Altas y Bajas ADR
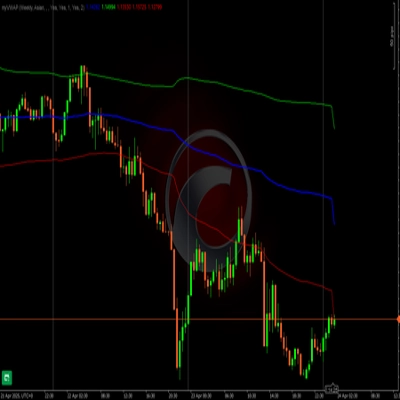
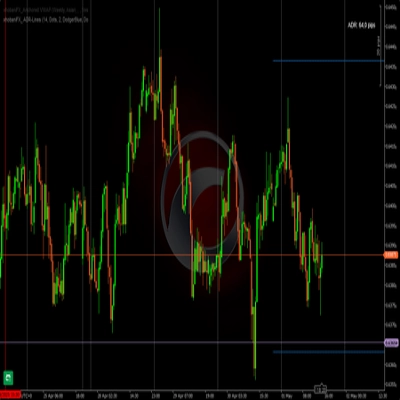
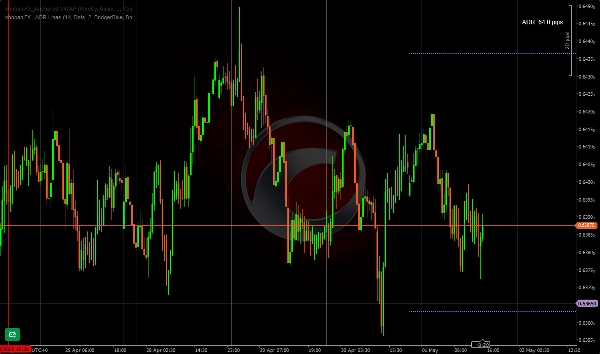
Este indicador ADR traza líneas horizontales para el mínimo/máximo del día actual basado en el período que el trader prefiera. Me gusta y uso 14 días como período base. Es más adecuado para scalpers/traders intradía. Así que puedes notar fácilmente cuando se ha alcanzado un máximo/mínimo, puedes elegir el color/estilo/ancho de las líneas para que cambien a un color diferente de tu elección una vez alcanzado.
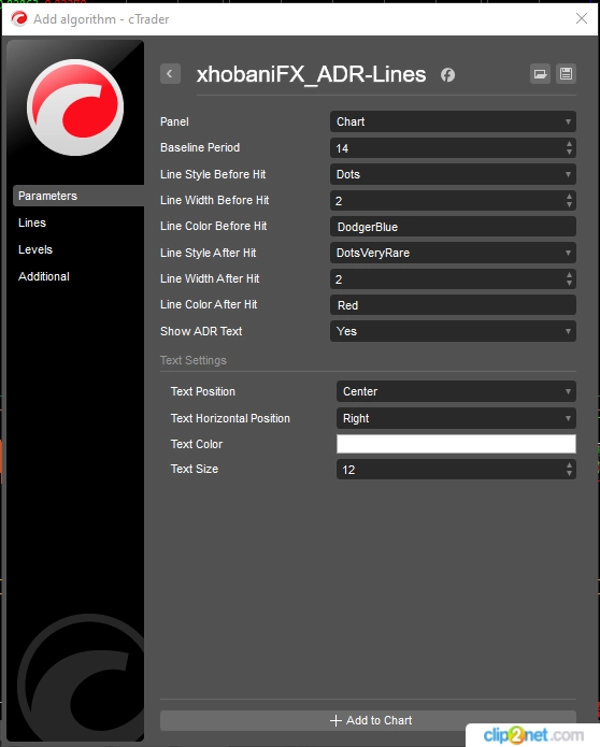
Este indicador está desarrollado de tal manera que puedes personalizar la mayoría de sus parámetros para adaptarlos a tus preferencias y alinearlos con tu espacio de trabajo y colores.
¡Feliz trading!
xhobani_FX
Resumen
Resumen de IA
xhobaniFX_ADR-Lines is an Average Daily Range (ADR) indicator designed for scalpers and intraday traders. It plots horizontal lines representing the current day's high and low levels based on a user-defined period, with 14 days commonly used as a baseline. The indicator visually highlights when these high or low levels are reached by allowing customization of line color, style, and width to change upon being hit. Most parameters are adjustable to fit individual trading preferences and workspace aesthetics. This tool aids traders in quickly identifying key price levels within the trading day.
Perfil del indicador
Valoraciones de clientes
4.0
Valoraciones: 2
5 | 0 % | |
4 | 100 % | |
3 | 0 % | |
2 | 0 % | |
1 | 0 % |
Conversación
Preguntas frecuentes
Los productos disponibles a través de cTrader Store, incluidos bots, indicadores y plugins para operar, son proporcionados por desarrolladores de terceros y están disponibles únicamente con fines informativos y de acceso técnico. cTrader Store no es un bróker, por lo que no proporciona asesoramiento de inversión, recomendaciones personales ni ninguna garantía de rentabilidad futura.