Descripción
VWAP Anclado
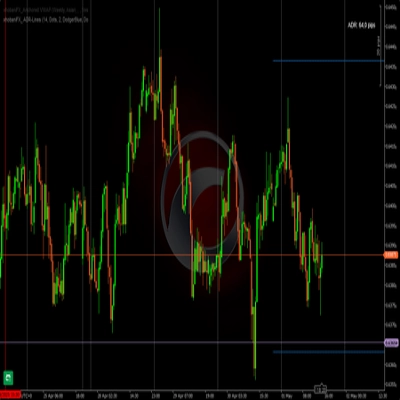
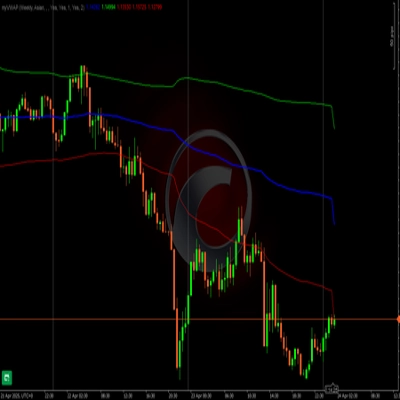
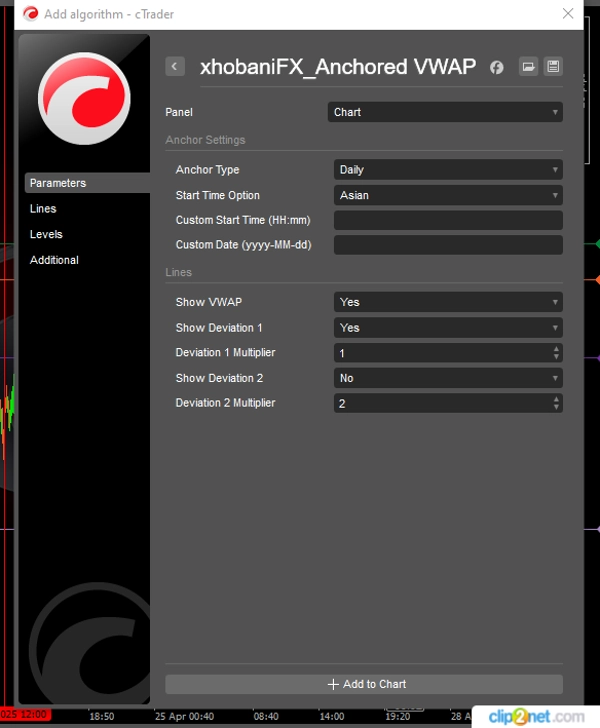
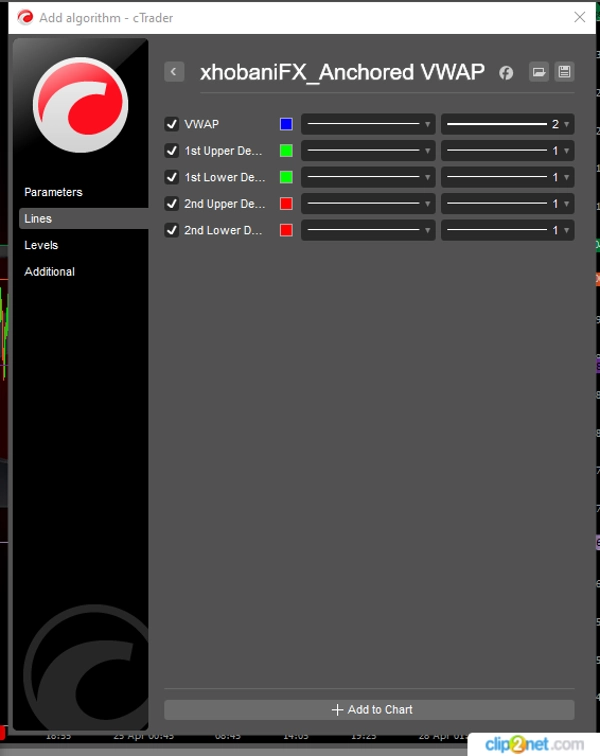
Este VWAP viene con una funcionalidad especial. Una vez que estableces el período de anclaje, tu VWAP y las desviaciones preferidas no cambian cuando cambias de marcos temporales. Personalmente uso este indicador en mi trading diario y análisis. El trader puede seleccionar entre tres períodos de anclaje, es decir, Diario, Semanal y Mensual. ¿Quieres usar una brecha de mercado, un máximo/mínimo oscilante como ancla? Te tengo cubierto. También puedes personalizar tu punto de anclaje deseado ingresando la fecha y la hora de inicio para el ancla en los parámetros de este indicador.
xhobani_FX prioriza la facilidad de uso, la optimización y la eficiencia. Se han considerado y tenido en cuenta los desafíos del trading en la vida real. Sigo probando, actualizando y mejorando todos mis indicadores. La satisfacción del cliente es clave... o quizás déjame decir que la satisfacción del trader es clave. ¡Espero que te satisfaga y regreses por más!
¡Feliz Trading!
Resumen
Valoraciones de clientes
5 | 100 % | |
4 | 0 % | |
3 | 0 % | |
2 | 0 % | |
1 | 0 % |