
Descripción
Nota: Probado solo en cTrader Windows.
Perfil de Volumen
Un perfil vertical dibujado en el gráfico de precios para mostrar en qué precio hay más/menos volumen (interés de negociación).
El indicador Flexible Volume Profile
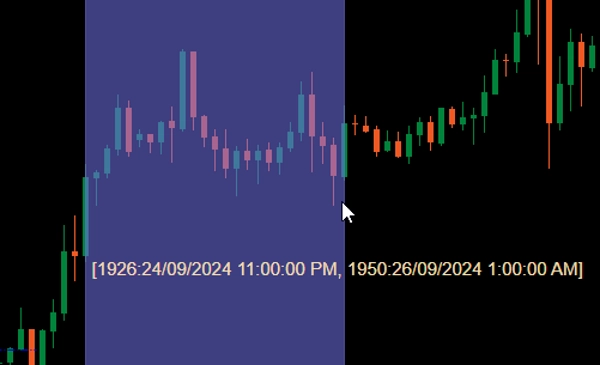
Cuando se añade a su gráfico, arrastre con Ctrl y el botón izquierdo del ratón sobre un área en el gráfico de precios para que se dibuje el perfil para esa área.
Para mejorar el rendimiento, el perfil se dibujará en 2 estados:
- Perfil grueso: El indicador usará el marco temporal definido por CoarseTF (por defecto m5) para cargar la información de volumen, esto suele ser rápido. Mientras se muestra el perfil grueso, el perfil fino se cargará en segundo plano.
- Perfil fino: Perfil más preciso, que usa el marco temporal definido por FineTF (por defecto m1), pero puede configurarse al más fino (t1 - tick único). Sin embargo, si está viendo un gráfico de marco temporal Diario o superior, configurar a marco temporal de ticks aumentará el tiempo de carga.
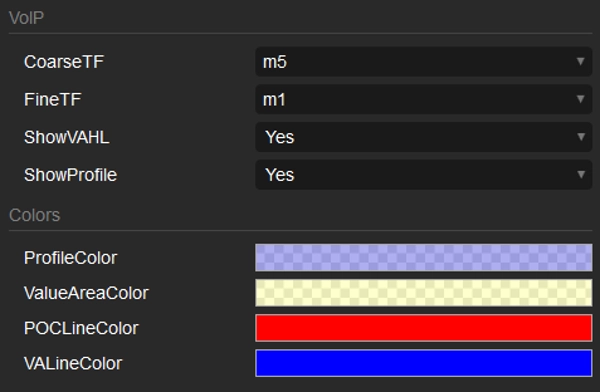
Parámetros
- CoarseTF: Marco temporal para datos gruesos (por defecto m5).
- FineTF: Marco temporal para datos finos (por defecto m1).
- ShowVAHL: Muestra el VAH (Valor Área Alto) y VAL (Valor Área Bajo).
- ShowProfile: Si es Sí, muestra el perfil completo, de lo contrario solo muestra VAH, VAL y POC (Punto de Control).
- Colors: Personalización de colores.
Cómo usar
Después de añadir el indicador a su gráfico de precios, use un arrastre con Ctrl y el botón izquierdo del ratón para seleccionar la región en el gráfico que desea perfilar y eso es todo.
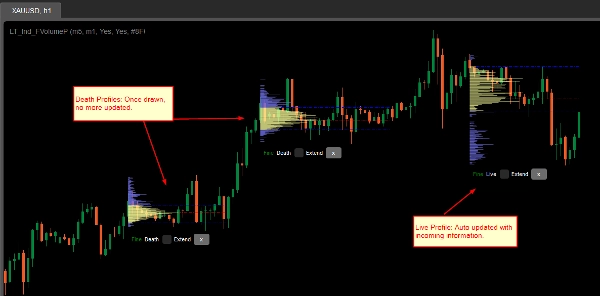
Después de que se renderice el perfil, verá alguna información/manipulación en la parte inferior del perfil:
- Grueso/Fino: estado del perfil.
- Muerto/Vivo: si su perfil cubre la última barra (vela), entonces es un perfil Vivo y se actualiza automáticamente con la información entrante.
- Casilla de verificación Extender: marque para que las líneas VAH, VAL y POC se extiendan hasta la última barra (vela)
- Botón x: Haga clic para eliminar el perfil del gráfico.
Resumen
Users activate the profile by holding Ctrl and dragging the mouse over a desired chart region. The indicator operates in two modes for performance optimization: a Coarse profile using a configurable timeframe (default 5 minutes) for faster loading, and a Fine profile using a finer timeframe (default 1 minute, with an option down to single ticks) for more precise volume data.
Key parameters include:
- CoarseTF and FineTF: timeframes for coarse and fine volume data aggregation.
- ShowVAHL: toggles display of Value Area High (VAH) and Value Area Low (VAL).
- ShowProfile: controls whether the full profile or only key levels (VAH, VAL, Point of Control) are shown.
- Colors: customizable color settings.
After rendering, the profile provides status indicators (Coarse/Fine, Live/Dead), options to extend VAH, VAL, and POC lines to the latest bar, and the ability to remove the profile. This tool supports detailed volume analysis to assist traders in identifying significant price levels based on traded volume.
Valoraciones de clientes
5 | 100 % | |
4 | 0 % | |
3 | 0 % | |
2 | 0 % | |
1 | 0 % |


