
LT_Ind_VWAP
Indicador
2 compras
Versión 1.0, Oct 2025
Windows, Mac
4.5
Valoraciones: 2
Descripción
Nota: Probado solo en cTrader Windows.
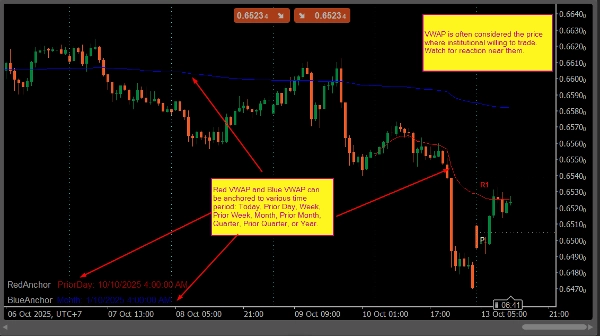
LT_Ind_VWAP es un indicador VWAP anclado práctico para cTrader.
Traza dos líneas VWAP (Roja y Azul) que pueden anclarse cada una a un período seleccionado, como Hoy, Día Anterior, Semana, Semana Anterior, Mes, Mes Anterior, Trimestre, Trimestre Anterior o Año.
El indicador se recalcula automáticamente cuando comienza un nuevo día y muestra el ancla activa y la fecha directamente en el gráfico. Está diseñado para traders que usan niveles VWAP para seguir el valor justo, la tendencia o áreas de reversión a la media.
Características principales
- Dos líneas VWAP con anclas independientes
- Anclas soportadas: Hoy, Día Anterior, Semana, Semana Anterior, Mes, Mes Anterior, Trimestre, Trimestre Anterior, Año
- Recalculo automático al cambiar de sesión
- Información del ancla mostrada en el gráfico
- Configuración simple, uso mínimo de recursos
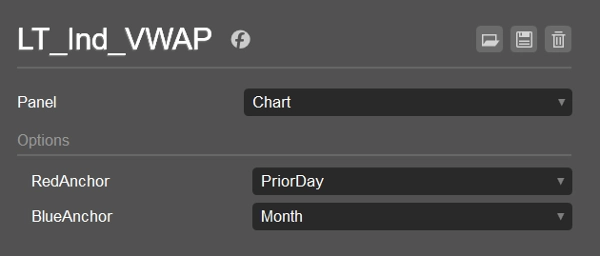
Configuración predeterminada
- VWAP Roja: Día Anterior
- VWAP Azul: Mes
Casos de uso
- Comparar el precio intradía con el VWAP del día anterior
- Monitorear VWAP mensual o trimestral para sesgo de oscilación
- Encontrar confluencia entre niveles VWAP a corto y largo plazo
Resumen
Resumen de IA
LT_Ind_VWAP is an anchored VWAP (Volume Weighted Average Price) indicator designed for the cTrader platform (Windows version). It displays two independent VWAP lines—red and blue—each anchored to selectable time periods including Today, Prior Day, Week, Prior Week, Month, Prior Month, Quarter, Prior Quarter, or Year. The indicator automatically recalculates at the start of a new trading session and shows the active anchor and date on the chart for easy reference. Its primary use cases include comparing intraday prices with prior-day VWAP, monitoring monthly or quarterly VWAP for swing trading bias, and identifying confluence between short- and long-term VWAP levels. The default settings anchor the red VWAP to the prior day and the blue VWAP to the current month. LT_Ind_VWAP offers a simple setup with minimal resource consumption, making it suitable for traders who rely on VWAP levels to assess fair value, trend direction, or mean-reversion zones across various markets such as Forex, indices, commodities, cryptocurrencies, and stocks.
Perfil del indicador
Valoraciones de clientes
4.5
Valoraciones: 2
5 | 50 % | |
4 | 50 % | |
3 | 0 % | |
2 | 0 % | |
1 | 0 % |
Valoraciones de clientes
October 26, 2025
Conversación
Preguntas frecuentes
Prop
Forex
Indices
Commodities
Crypto
Stocks
VWAP
Los productos disponibles a través de cTrader Store, incluidos bots, indicadores y plugins para operar, son proporcionados por desarrolladores de terceros y están disponibles únicamente con fines informativos y de acceso técnico. cTrader Store no es un bróker, por lo que no proporciona asesoramiento de inversión, recomendaciones personales ni ninguna garantía de rentabilidad futura.


![Logotipo de "[Stellar Strategies] MARSI Signal Plotter"](https://cdn.ctrader.com/image/webp/7b2b8da6-8f8e-4646-8d4a-4710c516c01e_25567)


Precio
Desde 25/09/2024
34
Ventas