
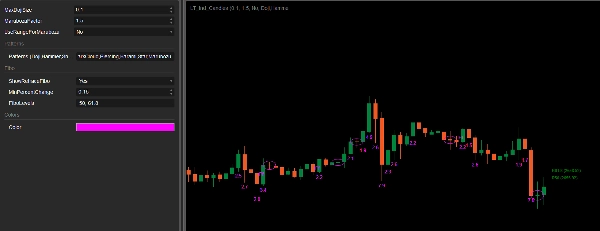
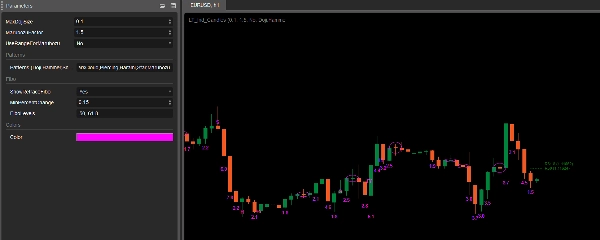
LT_Ind_Candles
Indikator
4 käufe
Version 1.0, Sep 2024
Windows, Mac
4.0
Bewertungen: 1
Beschreibung
Hinweis: Getestet nur auf cTrader Windows.
Einzelne Kerzenmuster:
- Doji
- Hammer
- Shooting Star
2-Kerzen-Muster:
- Engulf
- DarkCloud
- Piercing
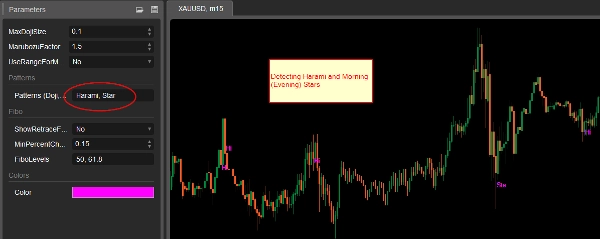
- Harami
3-Kerzen-Muster:
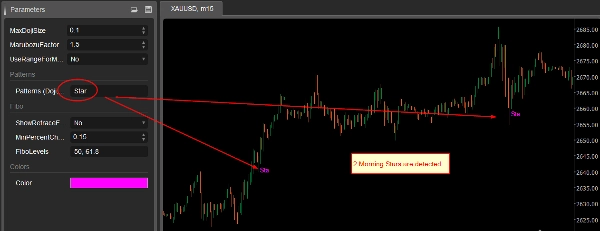
- Morning Stars
- Eveving Stars
Marubozu:
Wenn ausgewählt, wird die Größe der großen Kerzenkörper annotiert. Lesen Sie die Einstellungsbeschreibungen für die Größe.
Einstellungen:
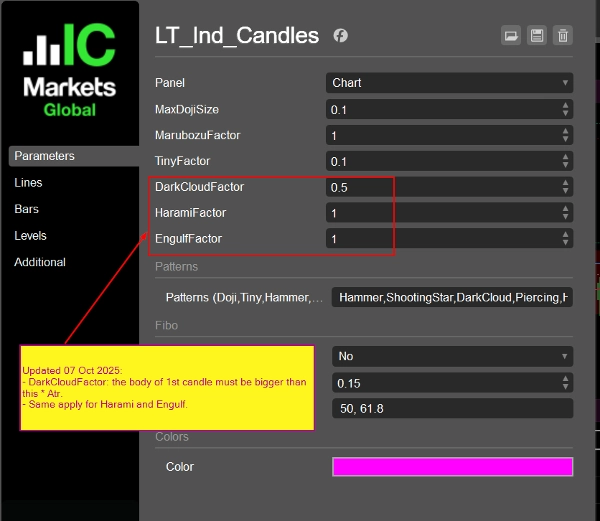
(Aktualisiert 07 Okt 2025:
- Verwenden Sie Atr (14 Perioden, einfacher gleitender Durchschnitt) anstelle von MedianBarBody
- Einstellungen für DarkCloud (und Piercing), Harami, Engulf Faktoren hinzugefügt
)
- MaxDojiSize: Das maximale Verhältnis zwischen Kerzenkörper und Kerzenbereich, um einen Doji zu betrachten (Standard 0,1).
- Marubozu Faktor: Der Kerzenkörper der aktuellen Kerze muss > MarubozuFactor * Atr sein, um als große Kerze (Marubozu) betrachtet zu werden. Der Docht ist hier egal.
- Verwenden Sie Bereich für Marubozu: Verwenden Sie BarRange (Hoch - Tief) anstelle von BarBody (Open - Close).MathAbs() bei der Überprüfung auf Marubozu.
- Muster: Geben Sie die Muster ein, die Sie erkennen möchten, getrennt durch Kommas. Akzeptierte Werte sind: Doji,Hammer,ShootingStar,Engulf,DarkCloud,Piercing,Harami,Star,Marubozu. Beachten Sie, dass wenn Sie "Star" wählen, sowohl Morning Stars als auch Evening Stars erkannt werden.
- Zeige Retrace Fibo: Ein Hilfs-Fibo-Level, um Ihnen beim Risikomanagement zu helfen. Wenn es 2 aufeinanderfolgende höhere Hochs und höhere Tiefs gibt, werden die angegebenen Fibo-Level, berechnet aus diesen 2 Kerzen, angezeigt. Sie können Ihren Einstieg halten, bis der Preis die Levels erreicht, um das Risiko zu kontrollieren. Die Levels sind einstellbar. Die Gegenseite ist gleich (niedrigere Hochs und niedrigere Tiefs).
- Minimale prozentuale Änderung: Die 2 Kerzen, die für die Fibo-Level verwendet werden, müssen eine Preisänderung > dieses Prozentsatzes bilden.
- Fibo-Level: Geben Sie Ihre Levels getrennt durch Kommas ein.
- Farbe: Farbe der Kerzenannotation.
Zusammenfassung
Indikatorprofil
Kundenbewertungen
4.0
Bewertungen: 1
5 | 0 % | |
4 | 100 % | |
3 | 0 % | |
2 | 0 % | |
1 | 0 % |
Diskussion
Häufig gestellte Fragen (FAQ)
Forex
Signal
Indices
Commodities
Crypto
Stocks
ATR
Über den cTrader Store verfügbare Produkte, einschließlich Handelsbots, Indikatoren und Plugins, werden von externen Entwicklern bereitgestellt und nur zu Informations- und technischen Zugriffszwecken verfügbar gemacht. cTrader Store ist kein Broker und erbringt keine Anlageberatung, persönlichen Empfehlungen oder eine Garantie für zukünftige Performance.


Preis
Seit 25/09/2024
34
Verkäufe